
Page 291 - Applied Statistics with R
P. 291
13.3. UNUSUAL OBSERVATIONS 291
when is large.
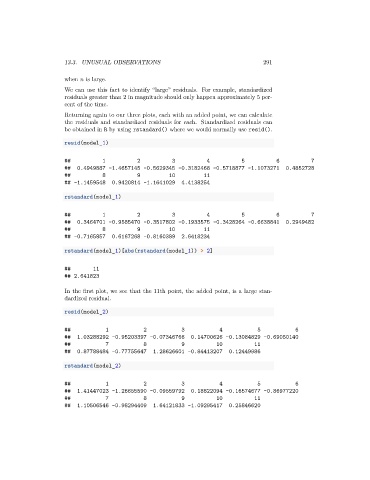
We can use this fact to identify “large” residuals. For example, standardized
residuals greater than 2 in magnitude should only happen approximately 5 per-
cent of the time.
Returning again to our three plots, each with an added point, we can calculate
the residuals and standardized residuals for each. Standardized residuals can
be obtained in R by using rstandard() where we would normally use resid().
resid(model_1)
## 1 2 3 4 5 6 7
## 0.4949887 -1.4657145 -0.5629345 -0.3182468 -0.5718877 -1.1073271 0.4852728
## 8 9 10 11
## -1.1459548 0.9420814 -1.1641029 4.4138254
rstandard(model_1)
## 1 2 3 4 5 6 7
## 0.3464701 -0.9585470 -0.3517802 -0.1933575 -0.3428264 -0.6638841 0.2949482
## 8 9 10 11
## -0.7165857 0.6167268 -0.8160389 2.6418234
rstandard(model_1)[abs(rstandard(model_1)) > 2]
## 11
## 2.641823
In the first plot, we see that the 11th point, the added point, is a large stan-
dardized residual.
resid(model_2)
## 1 2 3 4 5 6
## 1.03288292 -0.95203397 -0.07346766 0.14700626 -0.13084829 -0.69050140
## 7 8 9 10 11
## 0.87788484 -0.77755647 1.28626601 -0.84413207 0.12449986
rstandard(model_2)
## 1 2 3 4 5 6
## 1.41447023 -1.26655590 -0.09559792 0.18822094 -0.16574677 -0.86977220
## 7 8 9 10 11
## 1.10506546 -0.98294409 1.64121833 -1.09295417 0.25846620