Page 344 - Applied Statistics with R
P. 344

344                              CHAPTER 14. TRANSFORMATIONS


                                                          = exp(   +       ) ⋅ exp(   )
                                                                                
                                                                 0
                                                                     1   


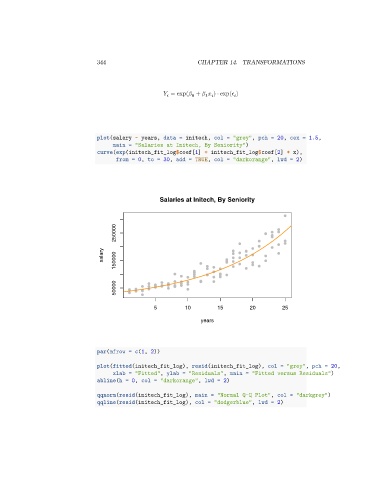
                                 plot(salary ~ years, data = initech, col = "grey", pch = 20, cex = 1.5,
                                      main = "Salaries at Initech, By Seniority")
                                 curve(exp(initech_fit_log$coef[1] + initech_fit_log$coef[2] * x),
                                       from = 0, to = 30, add = TRUE, col = "darkorange", lwd = 2)


                                                      Salaries at Initech, By Seniority


                                       250000


                                   salary  150000


                                       50000


                                                    5         10         15         20        25

                                                                   years


                                 par(mfrow = c(1, 2))

                                 plot(fitted(initech_fit_log), resid(initech_fit_log), col = "grey", pch = 20,
                                      xlab = "Fitted", ylab = "Residuals", main = "Fitted versus Residuals")
                                 abline(h = 0, col = "darkorange", lwd = 2)

                                 qqnorm(resid(initech_fit_log), main = "Normal Q-Q Plot", col = "darkgrey")
                                 qqline(resid(initech_fit_log), col = "dodgerblue", lwd = 2)
   339   340   341   342   343   344   345   346   347   348   349