
Page 348 - Applied Statistics with R
P. 348
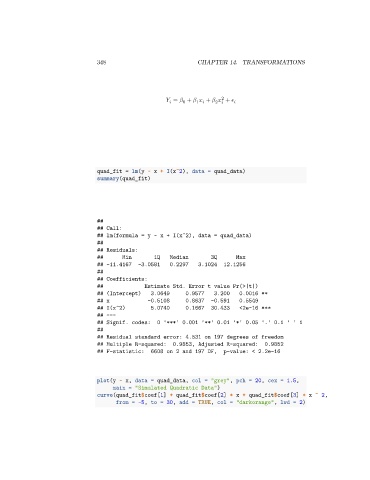
348                              CHAPTER 14. TRANSFORMATIONS


                                                                          2
                                                           =    +       +       +
                                                              0
                                                                  1
                                                                        2


                                 quad_fit = lm(y ~ x + I(x^2), data = quad_data)
                                 summary(quad_fit)


                                 ##
                                 ## Call:
                                 ## lm(formula = y ~ x + I(x^2), data = quad_data)
                                 ##
                                 ## Residuals:
                                 ##       Min       1Q   Median        3Q      Max
                                 ## -11.4167   -3.0581   0.2297    3.1024  12.1256
                                 ##
                                 ## Coefficients:
                                 ##              Estimate Std. Error t value Pr(>|t|)
                                 ## (Intercept)    3.0649     0.9577    3.200   0.0016 **
                                 ## x             -0.5108     0.8637   -0.591   0.5549
                                 ## I(x^2)         5.0740     0.1667   30.433   <2e-16 ***
                                 ## ---
                                 ## Signif. codes:   0 '***' 0.001 '**' 0.01 '*' 0.05 '.' 0.1 ' ' 1
                                 ##
                                 ## Residual standard error: 4.531 on 197 degrees of freedom
                                 ## Multiple R-squared:   0.9853, Adjusted R-squared:    0.9852
                                 ## F-statistic:   6608 on 2 and 197 DF,   p-value: < 2.2e-16


                                 plot(y ~ x, data = quad_data, col = "grey", pch = 20, cex = 1.5,
                                      main = "Simulated Quadratic Data")
                                 curve(quad_fit$coef[1] + quad_fit$coef[2] * x + quad_fit$coef[3] * x ^ 2,
                                       from = -5, to = 30, add = TRUE, col = "darkorange", lwd = 2)