Page 345 - Applied Statistics with R
P. 345

14.2. PREDICTOR TRANSFORMATION                                    345


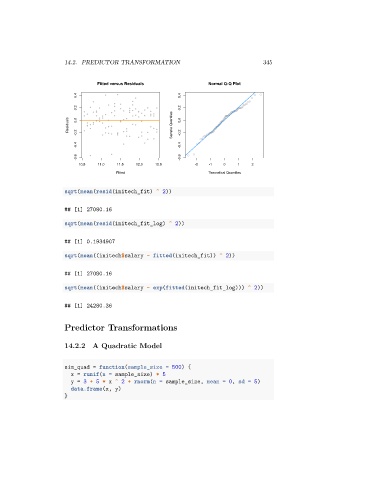
                                 Fitted versus Residuals              Normal Q-Q Plot
                          0.4                                0.4

                          0.2                                0.2
                        Residuals  0.0  -0.2              Sample Quantiles  0.0  -0.2


                          -0.4                               -0.4

                          -0.6                               -0.6
                           10.5  11.0   11.5  12.0  12.5          -2  -1   0    1   2
                                        Fitted                        Theoretical Quantiles


                      sqrt(mean(resid(initech_fit) ^ 2))


                      ## [1] 27080.16

                      sqrt(mean(resid(initech_fit_log) ^ 2))

                      ## [1] 0.1934907

                      sqrt(mean((initech$salary - fitted(initech_fit)) ^ 2))


                      ## [1] 27080.16

                      sqrt(mean((initech$salary - exp(fitted(initech_fit_log))) ^ 2))

                      ## [1] 24280.36


                      Predictor Transformations


                      14.2.2    A Quadratic Model


                      sim_quad = function(sample_size = 500) {
                        x = runif(n = sample_size) * 5
                        y = 3 + 5 * x ^ 2 + rnorm(n = sample_size, mean = 0, sd = 5)
                        data.frame(x, y)
                      }
   340   341   342   343   344   345   346   347   348   349   350