
Page 76 - Applied Statistics with R
P. 76
76 CHAPTER 5. PROBABILITY AND STATISTICS IN R
## Two Sample t-test
##
## data: values by group
## t = 1.8234, df = 12, p-value = 0.04662
## alternative hypothesis: true difference in means between group A and group B is greater than 0
## 95 percent confidence interval:
## 0.1802451 Inf
## sample estimates:
## mean in group A mean in group B
## 80 72
5.3 Simulation
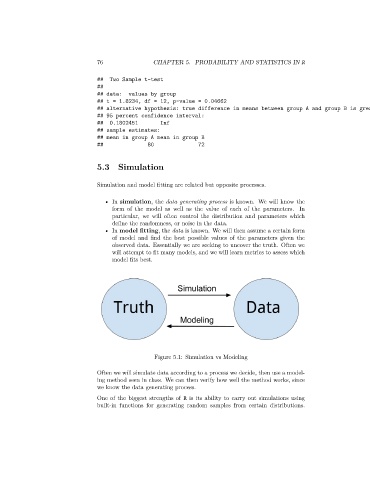
Simulation and model fitting are related but opposite processes.
• In simulation, the data generating process is known. We will know the
form of the model as well as the value of each of the parameters. In
particular, we will often control the distribution and parameters which
define the randomness, or noise in the data.
• In model fitting, the data is known. We will then assume a certain form
of model and find the best possible values of the parameters given the
observed data. Essentially we are seeking to uncover the truth. Often we
will attempt to fit many models, and we will learn metrics to assess which
model fits best.
Figure 5.1: Simulation vs Modeling
Often we will simulate data according to a process we decide, then use a model-
ing method seen in class. We can then verify how well the method works, since
we know the data generating process.
One of the biggest strengths of R is its ability to carry out simulations using
built-in functions for generating random samples from certain distributions.