
Page 92 - Applied Statistics with R
P. 92
92 CHAPTER 7. SIMPLE LINEAR REGRESSION
given value of as input, our output is a value of , within a certain range of
error. You could think of this a number of ways:
• Response = Prediction + Error
• Response = Signal + Noise
• Response = Model + Unexplained
• Response = Deterministic + Random
• Response = Explainable + Unexplainable
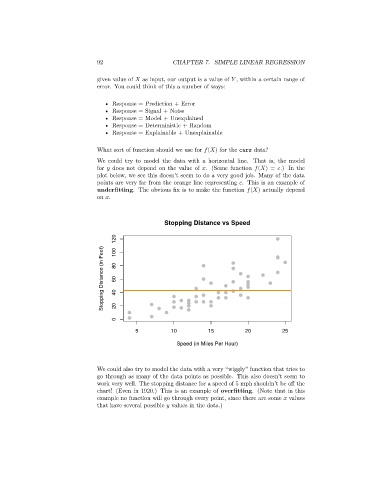
What sort of function should we use for ( ) for the cars data?
We could try to model the data with a horizontal line. That is, the model
for does not depend on the value of . (Some function ( ) = .) In the
plot below, we see this doesn’t seem to do a very good job. Many of the data
points are very far from the orange line representing . This is an example of
underfitting. The obvious fix is to make the function ( ) actually depend
on .
Stopping Distance vs Speed
120 100
Stopping Distance (in Feet) 80 60 40
0 20
5 10 15 20 25
Speed (in Miles Per Hour)
We could also try to model the data with a very “wiggly” function that tries to
go through as many of the data points as possible. This also doesn’t seem to
work very well. The stopping distance for a speed of 5 mph shouldn’t be off the
chart! (Even in 1920.) This is an example of overfitting. (Note that in this
example no function will go through every point, since there are some values
that have several possible values in the data.)