
Page 93 - Applied Statistics with R
P. 93
7.1. MODELING 93
Stopping Distance vs Speed
120 100
Stopping Distance (in Feet) 80 60 40
0 20
5 10 15 20 25
Speed (in Miles Per Hour)
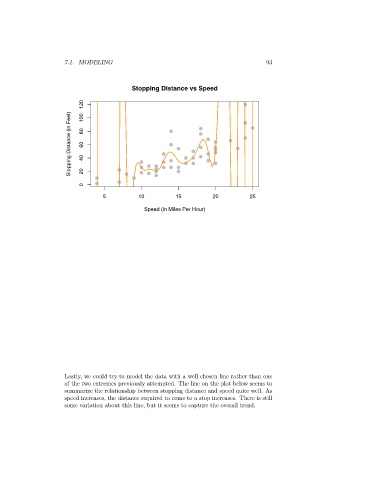
Lastly, we could try to model the data with a well chosen line rather than one
of the two extremes previously attempted. The line on the plot below seems to
summarize the relationship between stopping distance and speed quite well. As
speed increases, the distance required to come to a stop increases. There is still
some variation about this line, but it seems to capture the overall trend.