
Page 96 - Applied Statistics with R
P. 96
96 CHAPTER 7. SIMPLE LINEAR REGRESSION
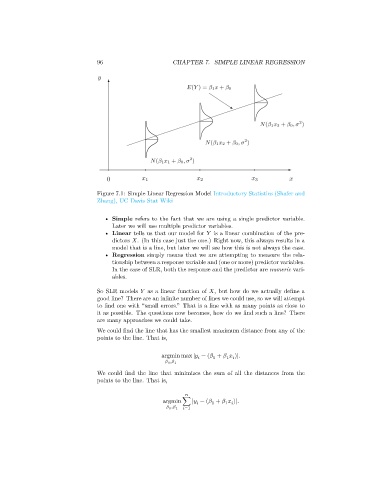
Figure 7.1: Simple Linear Regression Model Introductory Statistics (Shafer and
Zhang), UC Davis Stat Wiki
• Simple refers to the fact that we are using a single predictor variable.
Later we will use multiple predictor variables.
• Linear tells us that our model for is a linear combination of the pre-
dictors . (In this case just the one.) Right now, this always results in a
model that is a line, but later we will see how this is not always the case.
• Regression simply means that we are attempting to measure the rela-
tionship between a response variable and (one or more) predictor variables.
In the case of SLR, both the response and the predictor are numeric vari-
ables.
So SLR models as a linear function of , but how do we actually define a
good line? There are an infinite number of lines we could use, so we will attempt
to find one with “small errors.” That is a line with as many points as close to
it as possible. The questions now becomes, how do we find such a line? There
are many approaches we could take.
We could find the line that has the smallest maximum distance from any of the
points to the line. That is,
argmin max | − ( + )|.
0
1
0 , 1
We could find the line that minimizes the sum of all the distances from the
points to the line. That is,
argmin ∑ | − ( + )|.
1
0
=1
0 , 1