Page 8 - ANC20-Proceedings-Presentations-Full
P. 8

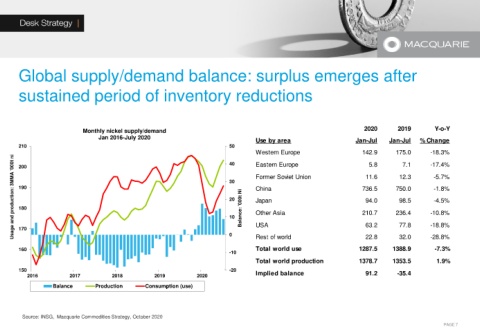
Global supply/demand balance: surplus emerges after


       sustained period of inventory reductions


                            Monthly nickel supply/demand                                                               2020       2019        Y-o-Y
                                 Jan 2016-July 2020
                                                                                    Use by area                      Jan-Jul   Jan-Jul    % Change
       210                                                                  50
                                                                                    Western Europe                     142.9      175.0      -18.3%
     Usage and production: 3MMA '000t ni  190                               30 Balance: '000t Ni  Former Soviet Union  736.5      750.0      -10.8%
                                                                            40
                                                                                                                         5.8
                                                                                    Eastern Europe
                                                                                                                                             -17.4%
                                                                                                                                    7.1
       200
                                                                                                                        11.6
                                                                                                                                   12.3
                                                                                                                                              -5.7%
                                                                                    China
                                                                                                                                              -1.8%
                                                                            20
                                                                                                                                              -4.5%
                                                                                                                        94.0
                                                                                                                                   98.5
                                                                                    Japan
       180
                                                                                                                       210.7
                                                                                    Other Asia
                                                                                                                                  236.4
                                                                            10
                                                                                                                        63.2
                                                                                                                                   77.8
       170
                                                                                                                                             -28.8%
                                                                                                                                   32.0
                                                                                    Rest of world
                                                                                                                        22.8
                                                                                    Total world use
                                                                                                                                              -7.3%
       160                                                                  0       USA                               1287.5     1388.9      -18.8%
                                                                            -10
                                                                                    Total world production            1378.7     1353.5        1.9%
       150                                                                  -20     Implied balance                     91.2      -35.4
          2016          2017         2018          2019          2020
                  Balance       Production      Consumption (use)
        Source: INSG,  Macquarie Commodities Strategy, October 2020
                                                                                                                                                 PAGE 7
   3   4   5   6   7   8   9   10   11   12   13