Page 10 - ANC20-Proceedings-Presentations-Full
P. 10

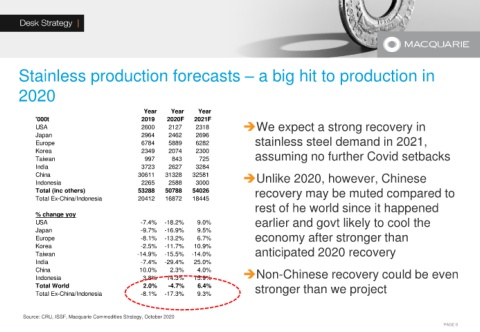
Stainless production forecasts – a big hit to production in


       2020


                                                Year     Year    Year
             '000t                             2019    2020F    2021F
             USA                               2600     2127     2318           ➔We expect a strong recovery in
             Japan                             2964     2462     2696
             Europe                            6784     5889     6282               stainless steel demand in 2021,
             Korea                             2349     2074     2300
             Taiwan                             997      843      725               assuming no further Covid setbacks
             India                             3723     2627     3284
             China                            30611    31328    32581           ➔Unlike 2020, however, Chinese
             Indonesia                         2265     2588     3000
             Total (inc others)               53288    50788    54026               recovery may be muted compared to
             Total Ex-China/Indonesia         20412    16872    18445
                                                                                    rest of he world since it happened
             % change yoy
             USA                               -7.4%  -18.2%     9.0%               earlier and govt likely to cool the
             Japan                             -9.7%  -16.9%     9.5%
             Europe                            -8.1%  -13.2%     6.7%               economy after stronger than
             Korea                             -2.5%  -11.7%    10.9%
             Taiwan                           -14.9%  -15.5%   -14.0%               anticipated 2020 recovery
             India                             -7.4%  -29.4%    25.0%
             China                            10.0%     2.3%     4.0%           ➔Non-Chinese recovery could be even
             Indonesia                         3.8%    14.3%    15.9%
             Total World                        2.0%    -4.7%    6.4%               stronger than we project
             Total Ex-China/Indonesia          -8.1%  -17.3%     9.3%


        Source: CRU, ISSF, Macquarie Commodities Strategy, October 2020
                                                                                                                                                 PAGE 9
   5   6   7   8   9   10   11   12   13   14   15