Page 238 - APPLIED PROCESS DESIGN FOR CHEMICAL AND PETROCHEMICAL PLANTS, Volume 1, 3rd Edition
P. 238

208                      Applied  Process Design for Chemical  and  Petrochemical Plants


                                   50   36                                              1  00
                                   45   34       I                                      90
                                          /8
                                   40   32     HEAD  CAPACIT)'                          80   800
                                 ....   .....   r---o
                                                                         EFFICIENCY
                                 0    ....          i-t"--  """-...     -            -   70 1-  700
                                 ...i  35  030   J   I   I                                 z
                                 v,   0                          /  <;                     ....
                                            ,... -TEMPERATURE  RISE   ,J   ....
                                 �  30  ci28             v  ...           ........       60 �  600   a:
                                                                                           ....
                                  �   �                                     r-,          50:  500  i
                                  �  25  � 26       �v                                -
                                  a:   -                                        '          �     ....
                                                                     � o9!> �   �  �
                                  ....   :I!   \              pO� �--
                                  �    20  �24    v                                      4oG  400   �
                                                                                    p-,
                                  .....   �   A'      �� 11-it'I\ ��            --         Li::   ....
                                  ffi  15  � 22                      ....-.....-         30 !!;  300  �
                                      � 20    x.  .--� I  ��  �.�·  ...,.,.,,.                   Iii
                                  j  10                                                  20   200
                                          1\/ c  �  ............  �
                                     5   18   »:       -......  -                        10   100
                                          L,
                                     0   16                                               0    0
                                          0      100    200     300    400     500     600
                                                            CAPACITY,  GPM
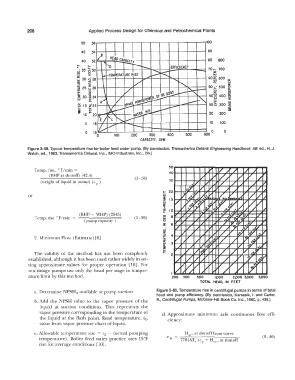
             Figure 3-59. Typical temperature rise for boiler feed water pump. (By permission, Transamerica De/aval Engineering Handbook,  4th ed.,  H. J.
             Welch,  ed.,  1983, Transamerica Delaval,  Inc.,  IMO Industries,  Inc.,  Div.)
                                                                        50
               Temp.  rise,  °F/min  =                                  40
                      (BHP at shutoff)  ( 42.4)           (3- 36)
                  (weight of liquid in pump)  (c  P   )                 30

                                                                      ....  20
             or                                                       w
                                                                      J:
                                                                      z   15
                                                                      w
                                                                      a:
                                                                      J:
                                                                      cf   10
                                  (BHP  - WHP)  (2545)                ""'
                                                                      c.?
                Temp. rise  ° F  /min                     (3-39)      w   8
                                     ( pump capacity  )               0
                                                                      �   6
                                                                      w
                                                                      a:
                                                                      ::,
               2.  Minimum Flow  (Estimate) [6]                       ....   4
                                                                      cf
                                                                      a:
                                                                      w   3
                                                                      CL
                                                                      2
                                                                      w
                                                                      ....
               The  validity  of the  method  has  not been  completely   2
             established, although it has been used rather widely in set-
             ting  approximate  values  for  proper operation  [10].  For
             multistage  pumps  use only  the head per stage in  temper-
             ature limit by  this method.                                     300   500    1,000   2,000  3.000   5,000
                                                                                     TOTAL  HEAD,  IN  FEET
                a.  Determine NPSHA available at pump suction      Figure 3-60. Temperature rise  in centrifugal  pumps in terms of total
                                                                   head  and  pump efficiency.  (By permission,  Karassik,  I.  and  Carter,
                b.  Add  the  NPSH  value  lo  the  vapor pressure  of the   R., Centrifugal Pumps,  McGraw-Hill  Book Co.  Inc.,  1960,  p. 438.)
                  liquid  at  suction  conditions.  This  represents  the
                  vapor pressure corresponding to the temperature of   d. Approximate  minimum  safe  continuous  flow  effi-
                  the  liquid  at the flash  point.  Read  temperature,  t2,   ciency:
                  value from vapor pressure chart ofliquid.
                c. Allowable  temperature  rise  =  t 2  - (actual  pumping    H, 0,  at shutofffrom curve
                  temperature).  Boiler feed water  practice  uses  15°F     778(6.Tr  )cp  +  Hso, at shutoff   (3 - 4-0)
                  rise for average conditions  [10].
   233   234   235   236   237   238   239   240   241   242   243