
Page 24 - Jurnal Pendidikan Tingkatan Enam 2019 - Jilid 3
P. 24
Perubahan Paradigma Pemikiran Ke Arah Pendidikan Berkualiti
Diagram 5.11 shows sample writing from student 4 done in the pre-test and post-test. The
answer script shows clear improvement in students’ ability to explain the melting point of
element in period 2.
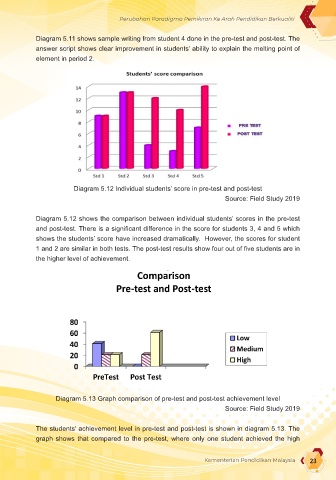
Diagram 5.12 Individual students’ score in pre-test and post-test
Source: Field Study 2019
Diagram 5.12 shows the comparison between individual students’ scores in the pre-test
and post-test. There is a significant difference in the score for students 3, 4 and 5 which
shows the students’ score have increased dramatically. However, the scores for student
1 and 2 are similar in both tests. The post-test results show four out of five students are in
the higher level of achievement.
.
Diagram 5.13 Graph comparison of pre-test and post-test achievement level
Source: Field Study 2019
The students' achievement level in pre-test and post-test is shown in diagram 5.13. The
graph shows that compared to the pre-test, where only one student achieved the high
Kementerian Pendidikan Malaysia 23