Page 41 - Spotlight A+ SPM Additional Mathematics Form 4 & 5
P. 41

Form
            5          Additional Mathematics    Chapter 6 Trigonometric Functions


                   Example 19                                    Example 20
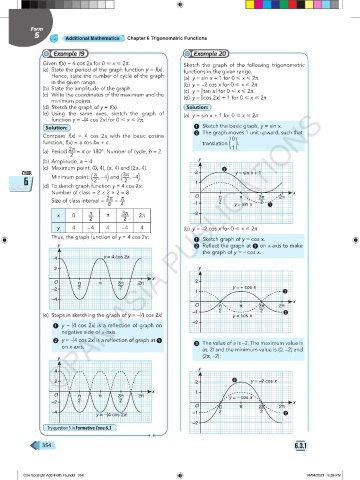
               Given f(x) = 4 cos 2x for 0 < x < 2π.          Sketch  the graph  of  the following  trigonometric
               (a)  State the period of the graph function y = f(x).   functions in the given range.
                  Hence, state the number of cycle of the graph   (a)  y = sin x + 1 for 0 < x < 2π
                  in the given range.
               (b)  State the amplitude of the graph.         (b)  y = –2 cos x for 0 < x < 2π
               (c)  Write the coordinates of the maximum and the   (c)  y = | tan x  | for 0 < x < 2π
                  minimum points.                             (d)  y = | cos 2x  | + 1 for 0 < x < 2π
               (d)  Sketch the graph of y = f(x).              Solution:
               (e)  Using the same axes, sketch the graph of   (a)  y = sin x + 1 for 0 < x < 2π
                     ©PAN ASIA PUBLICATIONS
                  function y = –|4 cos 2x| for 0 < x < 2π.
                Solution:                                        1  Sketch the basic graph, y = sin x.
               Compare  f(x) = 4 cos 2x  with the basic cosine   2  The graph moves 1 unit upward, such that
                                                                              0
               function, f(x) = a cos bx + c.                       translation  ( ) .
               (a)  Period  2π  = π or 180°. Number of cycle, b = 2.          1
                        2
               (b)  Amplitude, a = 4                               y
               (c)  Maximum point: (0, 4), (π, 4) and (2π, 4).
        CHAP.     Minimum point:  (  π  , –4  and  ( 3π , –4 )    2            y = sin x + 1
                                     )


         6                      2         2                       1
               (d)  To sketch graph function y = 4 cos 2x:
                  Number of class = 2 × 2 × 2 = 8                                                 x
                  Size of class interval =  2π  =   π             O       π – 2  π     3π     2π
                                                                                       ––
                                                                                        2
                                     8   4                       –1            y = sin x

                    x    0     π    π     3π   2π                –2
                               2          2
                    y    4    – 4   4    – 4    4             (b)  y = –2 cos x for 0 < x < 2π
                  Thus, the graph function of y = 4 cos 2x:      1  Sketch graph of y = cos x.
                    y                                            2  Reflect the graph at 1 on x-axis to make
                                                                    the graph of y = – cos x.
                   4               y = 4 cos 2x
                   2                                               y
                                                    x
                   O       π      π     3π     2π                 2
                           –            ––
                  –2       2             2                                    y = – cos x
                                                                  1
                  –4                                                                              x
                                                                  O       π      π     3π     2π
                                                                          – 2          ––
                                                                                        2
               (e)  Steps in sketching the graph of y = –|4 cos 2x|  –1       y = cos x
                   1  y = |4 cos 2x|  is a reflection of graph on   –2
                      negative side of x-axis.
                   2  y = –|4 cos 2x| is a reflection of graph at 1   3  The value of a is –2. The maximum value is
                      on x-axis.
                                                                    (π, 2) and the minimum value is (0, –2) and
                    y                                               (2π, –2).
                                                                   y
                   4

                   2                                              2                 y = –2 cos x
                                                    x             1
                   O       π      π     3π     2π
                           –            ––                                   y = – cos x
                  –2       2             2                                                        x
                                                                  O       π      π     3π     2π
                                                                          –            ––
                  –4                                             –1       2             2
                                 y = –|4 cos 2x|
                                                                 –2
                 Try question 3 in Formative Zone 6.3
               354                                                                                 6.3.1


         C06 Spotlight Add Math F5.indd   354                                                          16/04/2021   5:39 PM
   36   37   38   39   40   41   42   43   44   45   46