Page 12 - Spotlight A+ Physics Form 4.5
P. 12

Form
                                                                                                          4
                                                                              Chapter 4 Heat   Physics

                  Relationship between Pressure and Volume of a Gas


                                    4.4

                  Inference:  The volume of a gas affects the pressure of the gas.
                  Hypothesis: The smaller the volume of a gas, the higher the pressure of the gas.
                  Aim:  To determine the relationship between the volume and pressure of a fixed mass of gas at a constant
                       temperature.
                     ©PAN ASIA PUBLICATIONS
                    ©PAN ASIA PUBLICATIONS
                  Variables:
                  (a)  Manipulated  : Volume, V
                  (b)  Responding  : Pressure, P
                  (c)  Constant   : Temperature and mass of air
                  Apparatus:  100 ml syringe, rubber tube, pressure gauge and retort stand with clamp
                  Procedure:
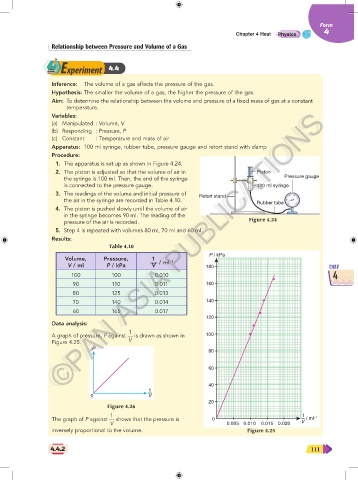
                    1.  The apparatus is set up as shown in Figure 4.24.
                    2.  The piston is adjusted so that the volume of air in          Piston
                      the syringe is 100 ml. Then, the end of the syringe                    Pressure gauge
                      is connected to the pressure gauge.                            100 ml syringe
                    3.  The readings of the volume and initial pressure of   Retort stand
                      the air in the syringe are recorded in Table 4.10.
                                                                                    Rubber tube
                    4.  The piston is pushed slowly until the volume of air
                      in the syringe becomes 90 ml. The reading of the
                      pressure of the air is recorded.                            Figure 4.24
                    5.  Step 4 is repeated with volumes 80 ml, 70 ml and 60 ml.
                  Results:
                                    Table 4.10
                                                                     P / kPa
                      Volume,      Pressure,      1     –1
                       V / ml       P / kPa       V   / ml          180                                     CHAP
                        100          100           0.010                                                     4
                         90          110           0.011            160
                         80          125           0.013
                         70          140           0.014            140
                         60          165           0.017
                                                                    120
                  Data analysis:
                                           1
                  A graph of pressure, P against   is drawn as shown in   100
                  Figure 4.25.             V
                               P
                                                                     80

                                                                     60


                                                                     40
                                                 1
                                                 —
                               0                 V
                                    Figure 4.26                      20
                                     1                                                             1
                  The graph of P against   shows that the pressure is    0                         – / ml –1
                                     V                                     0.005 0.010  0.015 0.020  V
                  inversely proportional to the volume.                          Figure 4.25

                 4.4.2                                                                                111
   7   8   9   10   11   12   13   14   15   16   17