
Page 284 - Towards Trustworthy Elections New Directions in Electronic Voting by Ed Gerck (auth.), David Chaum, Markus Jakobsson, Ronald L. Rivest, Peter Y. A. Ryan, Josh Benaloh, Miroslaw Kutylowski, Ben Adida ( (z-lib.org (1)
P. 284
R. Ara´ujo, R.F. Cust´odio, and J. van de Graaf
276
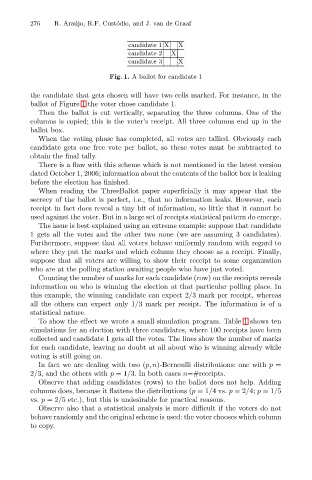
candidate 1 X
X
X
candidate 2
X
candidate 3
Fig. 1. A ballot for candidate 1
the candidate that gets chosen will have two cells marked. For instance, in the
ballot of Figure 1 the voter chose candidate 1.
Then the ballot is cut vertically, separating the three columns. One of the
columns is copied; this is the voter’s receipt. All three columns end up in the
ballot box.
When the voting phase has completed, all votes are tallied. Obviously each
candidate gets one free vote per ballot, so these votes must be subtracted to
obtain the final tally.
There is a flaw with this scheme which is not mentioned in the latest version
dated October 1, 2006; information about the contents of the ballot box is leaking
before the election has finished.
When reading the ThreeBallot paper superficially it may appear that the
secrecy of the ballot is perfect, i.e., that no information leaks. However, each
receipt in fact does reveal a tiny bit of information, so little that it cannot be
used against the voter. But in a large set of receipts statistical pattern do emerge.
The issue is best explained using an extreme example: suppose that candidate
1 gets all the votes and the other two none (we are assuming 3 candidates).
Furthermore, suppose that all voters behave uniformly random with regard to
where they put the marks and which column they choose as a receipt. Finally,
suppose that all voters are willing to show their receipt to some organization
who are at the polling station awaiting people who have just voted.
Counting the number of marks for each candidate (row) on the receipts reveals
information on who is winning the election at that particular polling place. In
this example, the winning candidate can expect 2/3 mark per receipt, whereas
all the others can expect only 1/3 mark per receipt. The information is of a
statistical nature.
To show the effect we wrote a small simulation program. Table 1 shows ten
simulations for an election with three candidates, where 100 receipts have been
collected and candidate 1 gets all the votes. The lines show the number of marks
for each candidate, leaving no doubt at all about who is winning already while
voting is still going on.
In fact we are dealing with two (p, n)-Bernoulli distributions: one with p =
2/3, and the others with p =1/3. In both cases n=#receipts.
Observe that adding candidates (rows) to the ballot does not help. Adding
columns does, because it flattens the distributions (p =1/4vs. p =2/4; p =1/5
vs. p =2/5 etc.), but this is undesirable for practical reasons.
Observe also that a statistical analysis is more difficult if the voters do not
behave randomly and the original scheme is used: the voter chooses which column
to copy.