
Page 31 - PESY Vol 7 No 4
P. 31
PESY: Print ISSN 2231-1394, Online ISSN 2278-795X Vol. 7 No 4
players who did not represent various games and sports during 2016-2017 were selected
as subjects at random. The age of the subjects were ranged between 18 to 24 years. The
following bio chemical variables namely high density lipoprotein and low density
lipoprotein were selected as criterion variables. All the subjects were tested on selected
criterion variables with standardized test items namely HDL- Cholesterol Precipitating
Reagent PEG – PAP Method with qualified lab technician. The collected data were
statistically analysed with the independent ‘t’ test to find out the significant difference
between men university and non-university players of various disciplines on selected
biochemical variables. The .05 level of confidence was fixed as the level of significance to
test the significance, which was considered as an appropriate.
ANALYSIS OF THE DATA
The mean, standard deviation and ‘t’ ratio values on high density
lipoprotein of university and non-university players of various disciplines have been
analyzed and presented in Table I.
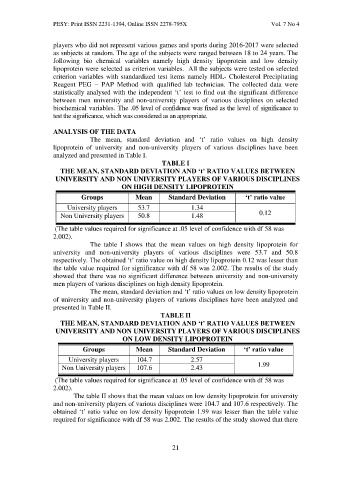
TABLE I
THE MEAN, STANDARD DEVIATION AND ‘t’ RATIO VALUES BETWEEN
UNIVERSITY AND NON UNIVERSITY PLAYERS OF VARIOUS DISCIPLINES
ON HIGH DENSITY LIPOPROTEIN
Groups Mean Standard Deviation ‘t’ ratio value
University players 53.7 1.34
Non University players 50.8 1.48 0.12
(The table values required for significance at .05 level of confidence with df 58 was
2.002).
The table I shows that the mean values on high density lipoprotein for
university and non-university players of various disciplines were 53.7 and 50.8
respectively. The obtained ‘t’ ratio value on high density lipoprotein 0.12 was lesser than
the table value required for significance with df 58 was 2.002. The results of the study
showed that there was no significant difference between university and non-university
men players of various disciplines on high density lipoprotein.
The mean, standard deviation and ‘t’ ratio values on low density lipoprotein
of university and non-university players of various disciplines have been analyzed and
presented in Table II.
TABLE II
THE MEAN, STANDARD DEVIATION AND ‘t’ RATIO VALUES BETWEEN
UNIVERSITY AND NON UNIVERSITY PLAYERS OF VARIOUS DISCIPLINES
ON LOW DENSITY LIPOPROTEIN
Groups Mean Standard Deviation ‘t’ ratio value
University players 104.7 2.57
Non University players 107.6 2.43 1.99
(The table values required for significance at .05 level of confidence with df 58 was
2.002).
The table II shows that the mean values on low density lipoprotein for university
and non-university players of various disciplines were 104.7 and 107.6 respectively. The
obtained ‘t’ ratio value on low density lipoprotein 1.99 was lesser than the table value
required for significance with df 58 was 2.002. The results of the study showed that there
21