
Page 28 - PESY Vol 7 No 4
P. 28
e
2
i
n
N
S
I
2
S
,
4
9
8
O
3
PESY: Print ISSN 2231-1394, Online ISSN 2278-795X Vol. 7 No 4
1
7
l
n
f
s
n
n
of
o
s
.
4
64
.6
e
s
xp
e
s
t
t
E
Expe
r
r
i
i
e
t
t
m
m
or
a
e
or
a
n
n
f
f
m
m
e
e
e
t
a
t
t
ng
n
R
i
i
t
e
r
r
e
e
e
e
g
e
e
a
P
l
w
w
l
74
74
The adjusted post-test means of Resting Pulse Rate were 74.64 for Experimental
e
a
a
R
R
e
ul
ul
s
e
s
P
s
t
s
t
R
m
22
i
obt
ont
o
ont
i
i
or
a
E
E
nd
nd
n
n
i
or
e
f
b
r
r
xp
a
C
xpe
f
C
t
m
a
a
.
G
r
G
G
G
r
I
oup.
oup
r
I
r
oup
I
I
oup
l
h
r
r
n
75
75
n
.
.
22
e
e
e
e
Th
a
a
T
l
n
nd
t
t
d
ol
ol
r
4
3
37
d
o
I
F
7
or
or
r
f
“
a
up
.
.
oup
d
a
“
f
”
”
7
,
,
Group I, 74.37 for and Experimental Group II and 75.22 for Control Group. The obtained “F”
e
e
G G
74
F
I
t
-
r
n
l
0
763
he
s
e
ha
.
t
s
a
a
ratio 0.763 was lesser than the table FF-ratio 3.09. Hence the adjusted post-test was not
i
bl
t
e
o
s
e
w
e
c
nt
c
onf
nt
onf
t
0
f
e
d
d
f
r
r
1
c
116
e
e
a
e
e
5
g
g
’
c
’
n
nd
0
.
16
.
t
or
i
h
f
h
i
t
a
a
nd
nd
de
de
or
a
a
a
a
e
e
n
f
t
f
f
n
05
0
e
e
2
2
e
e
r
r
h
f
v
c
v
c
s
i
of
i
s
of
e
e
g
g
S
f
S
l
f
i
i
e
of
o
l
ni
c
c
e
ni
e
e
dom
s
f
e
s
s s significant at 0.05 level of confidence for the degrees of freedom 2 and 116 and Scheffe’s
l
l
a
e
h
e
f
e
dom
d
s
a
ol
s
T
e
not
.
d
f
Post-hoc Test was not followed.
t
w
hoc
l
ow
e
O
D
T
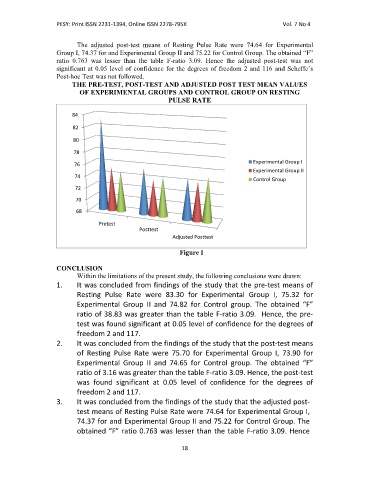
THE PRE-TEST, POST-TEST AND ADJUSTED POST TEST MEAN VALUES
T
L
A
A
S
N
E
T
N
U
T
M
E
S
S
P
T
A
A
V
JU
D
E
T
E
E
S
S
D
A
U
G
T
P
S
R
G
O
N
A
T
R
N
X
N
D
O
C
N
I
O
R
OF EXPERIMENTAL GROUPS AND CONTROL GROUP ON RESTING
O
U
O O F E X P E R I M E N T A L G R O U P S A N D C O N T R O L G R O U P O N R E S T I I N G
PE
L
E
T
G
L
P
F
S
R
R
O
E
M
N
E
PULSE RATE
84
82
80
78
G
m
i
l
u
t
o
p
x
n
e
p
r
r
a
e
76 E Experimental Group II
p
t
a
e
n
p
u
i
r
e
m
l
G
x
I
E Experimental Group III
o
r
74
C o n t r o l Gr o u p
Control Group
72
70
68
Pretest
Posttestt
P o s t t e s
Adjusted Posttest
Figure I
CONCLUSION
onc
,
ow
e
ow
ons
W W
n
c
he
t
o
e
t
Within the limitations of the present study, the following conclusions were drawn::
he
c
on
t
nt
l
l
nt
t
ol
t
t
i
us
s
hi
hi
s
us
i
e
i
i
e
f
s
f
nc
s
udy
ng
ol
udy,
ng
l
i
i
l
n
e
w
i
t
pr
e
i
he
pr
i
n
t
h
t
e
i
i
t
o
o
r
ons
r
o
t
w
i
dr
t
dr
t
w
l
a
a
l
h
e
w
a
a
t
h
e
m
ns
e
e
m
s
f
n:
f
u
e
o
I
o
a
d
f
h
l
c
e
h
e
d
t
m
y
gs
f
s
1. It was concluded from findings of the study that the pre-test means of
w
a
r
t
t
i
s
t
a
f
i
n
t
d
n
t
h
e
c
t
d
s
f
u
o
n
s
t
e
n
m
o
I
r
2
I
.
f
e
r
s
R R
t
0
0
u
s
f
t
2
m
r
P
o
e
n
,
l
l
t
e
,
P
.
m
o
e
e
o
t
o
e
a
a
n
e
r
e
g
R
x
5
5
i
x
e
t
e
g
l
u
3
R
3
Resting Pulse Rate were 83.30 for Experimental Group I, 75.32 for
t
8
e
r
e
p
p
u
u
n
n
o
o
r
8
p
i
i
p
r
.
7
.
r
i
3
7
3
f
3
3
Gr
w
s
s
G
l
E
E
a
e
a
f
r
w
e
u
o
”
o
gr
u
e
gr
n
o
o
”
n
n
r
o
r
n
n
r
C
a
t
C
Experimental Group II and 74.82 for Control group. The obtained “F”
a
l
G
l
l
i
i
l
t
r
n
Gr
o
E E
e
8
a
o
i
i
e
8
t
p
a
t
p
e
p
p
.
e
.
I
a
4
4
e
T
T
I
.
.
m
o
m
a
I
I
e
x
d
7
f
f
t
x
d
d
7
d
o
o
r
o
r
o
h
“
p
b
p
2
2
“
F
F
n
u
u
t
h
e
n
b
r
.
w
p
e
e
H
3
r
a
t
t
o
l
t
c
t
t
t
o
h
g
i
0
f
8
.
s
e
8
a
3
r
3
e
a
ratio of 38.83 was greater than the table FF-ratio 3.09. Hence, the pree-
,
r
t
9
b
h
e
h
a
.
o
n
a
r
a
r
n
e
e
i
c
n
e
i
e
0
.
h
c
5
c
i
e
f
a
n
s
r
t
a
0
f
o
t
t
f
l
test was found significant at 0.05 level of confidence for the degrees of
d
o
i
s
o
gr
f
f
e
n
e
o
e
n
l
e
g
d
v
i
e
freedom 2 and 117.
u
t
-
e
h
t
y
d
a
h
t
h
t
c
o
n
o
s
s
a
e
s
h
f
d
e
t
d
c
f
e
m
r
u
o
l
f
n
I
t
i
g
i
w
d
t
n
2. It was concluded from the findings of the study that the post-test means
t
t
a
,
5
a
n
o
o
5
I
n
I
,
.
r
e
e
7
7
l
e
e
.
R
R
l
e
u
e
e
t
u
e
0
0
r
a
r
o
a
r
o
e
e
f
f
G
7
7
w
w
t
7
7
p
p
Gr
s
p
f
g
p
m
e
g
m
r
E
e
P
E
9
r
9
e
s
i
0
i
i
t
t
0
x
x
n
n
e
o o
i
s
3
3
l
r
r
o
r
s
of Resting Pulse Rate were 75.70 for Experimental Group I, 73.90 for
o
f
l
u
.
R
R
f
.
f
u
P
e
7
a
o
d
“
F
x
T
u
n
5
i
e
E
p
n
r
u
”
l
6
e
p
b
C
a
t
i
gr
Experimental Group II and 74.65 for Control group. Thhe obtained “F”
Gr
o
n
a
r
t
I
t
d
o
4
o
f
.
r
m
p
l
.
n
e
I
o
o
H
ratio of 3.16 was greater than the table F-ratio 3.09. Hence, the post-test
e
r
s
a
h
p
o
e
g
t
e
r
c
e
n
t
t
e
,
r
o
i
3
.
9
0
t
.
a
i
f
l
f
n
n
d
a
n
d
c
a
i
n
c
l
t
v
v
h
t
t
e
t
e
h
t
c
c
t
e
e
e
a
a
e
s
c
i
f
c
s
d
d
i
e
e
n
n
o
f
f
was found significant at 0.05 level of confidence for the degrees of
f
o
o
o
e
e
n
g
g
o
i
e
e
n
o
i
f
s
s
e
e
f
i
g
g
r
r
i
r
l
f
r
f
5
l
o
o
0
e
5
0
0
.
e
0
.
freedom 2 and 117.
t
t
f
m
n
n
e
j
e
h
j
h
t
r
o
o
t
i
i
r
u
f
f
h
m
s
u
f
s
t
o
e
o
s
s
t
i
s
t
t
n
u
u
s
i
n
d
d
t
t
t
t
y
t
y
t
d
p
d
e
d
h
h
p
d
e
s
o
a
f
a
h
gs
e
g
a
d
o
t
e
f
e
a
t
h
d
h
3. It was concluded from the findings of the study that the adjusted post-
u
R
R
e
e
l
o
o
l
l
a
r
r
n
m
n
p
m
a
i
i
u
e
o
r
e
p
e
a
o
f
e
m
m
f
a
p
e
e
Gr
e
e
4
G
e
e
p
e
R
4
R
s
4
e
n
,
7
4
,
w
n
I
w
n
n
s
s
f
t
x
e
f
7
e
g
t
t
6
6
x
t
test means of Resting Pulse Rate were 74.64 for Experimental Group I,
g
I
r
o
t
o
E
E
.
u
r
u
t
s
s
a
i
i
r
r
P
P
s
.
l
a
.
r
d
d
.
a
r
a
7
.
C
e
e
3
p
t
.
7
3
5
5
o
t
p
C
4
4
a
74.37 for and Experimental Group II and 75.22 for Control Group. The
7 7
t
f
T
T
f
o
o
2
2
r
7
7
h
t
o
.
.
h
r
r
E
Gr
E
l
Gr
x
x
a
r
a
l
n
u
i
u
u
I
f
e
p
n
e
e
p
o
o
r
I
e
f
n
p
n
d
p
d
2
o
n
o
o
m
2
m
o
n
I
G
I
l
n
Gr
u
a
i
n
o
r
l
r
o
w
7
e
e
.
obtained “F” ratio 0.763 was lesser than the table FF-ratio 3.09. Hence
0
h
o
t
a
t
.
3
b
a
r
e
t
i
d
o
s
s
n
e
r
e
e
H
”
“
F
a
n
t
e
c
i
9
i
t
o
0
l
b
6
a
h
a
3
.
a
s
n
r
l
t
18