
Page 27 - PESY Vol 7 No 4
P. 27
PESY: Print ISSN 2231-1394, Online ISSN 2278-795X Vol. 7 No 4
Control Group. All the subjects were given basic Strength Training Exercises without Weight
and with minimal Weight for three weeks prior to pre-test and training in order to get initial
adaptation for undergoing Resistance Training during their Training period. Initial tests were
taken for all the subjects on Resting Pulse Rate. All the two experimental groups were given
training for a period of sixteen weeks. For the first twelve weeks the subjects were trained for
three non-consecutive days per week and for the next four weeks the subjects were trained on
alternate days.
Experimental Group I was given resistance training with low intensity and high
volume. Experimental Group II performed resistance training with medium intensity and low
volume. Experimental Group III served as Control Group. The subjects were tested on
selected Criterion Variables prior and immediately after the sixteen weeks of training
programme as pre and post-tests respectively. The collected data were analyzed statistically
by using ANCOVA.
RESULTS
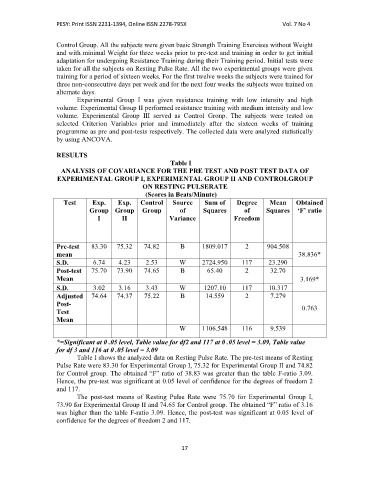
Table I
ANALYSIS OF COVARIANCE FOR THE PRE TEST AND POST TEST DATA OF
EXPERIMENTAL GROUP I, EXPERIMENTAL GROUP II AND CONTROLGROUP
ON RESTING PULSERATE
(Scores in Beats/Minute)
Test Exp. Exp. Control Source Sum of Degree Mean Obtained
Group Group Group of Squares of Squares ‘F’ ratio
I II Variance Freedom
Pre-test 83.30 75.32 74.82 B 1809.017 2 904.508
mean 38.836*
S.D. 6.74 4.23 2.53 W 2724.950 117 23.290
Post-test 75.70 73.90 74.65 B 65.40 2 32.70
Mean 3.169*
S.D. 3.02 3.16 3.43 W 1207.10 117 10.317
Adjusted 74.64 74.37 75.22 B 14.559 2 7.279
Post-
Test 0.763
Mean
W 1106.548 116 9.539
*=Significant at 0 .05 level, Table value for df2 and 117 at 0 .05 level = 3.09, Table value
for df 3 and 116 at 0 .05 level = 3.09
Table I shows the analyzed data on Resting Pulse Rate. The pre-test means of Resting
Pulse Rate were 83.30 for Experimental Group I, 75.32 for Experimental Group II and 74.82
for Control group. The obtained “F” ratio of 38.83 was greater than the table F-ratio 3.09.
Hence, the pre-test was significant at 0.05 level of confidence for the degrees of freedom 2
and 117.
The post-test means of Resting Pulse Rate were 75.70 for Experimental Group I,
73.90 for Experimental Group II and 74.65 for Control group. The obtained “F” ratio of 3.16
was higher than the table F-ratio 3.09. Hence, the post-test was significant at 0.05 level of
confidence for the degrees of freedom 2 and 117.
17