
Page 431 - Math Smart - 7
P. 431
CHAPTER 18.3 in this chapter
Pupils should be able to:
• compare experimental
and theoretical
probabilities in simple
contexts
• use experimental
data to estimate
probabilities
183.1 Theoretical probability
Recall that probabilities we have calculated earlier are based on equally likely ^ RECALL
outcomes. They are theoretical probabilities.
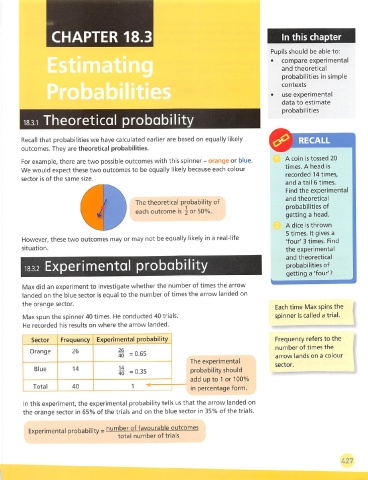
For example, there are two possible outcomes with this spinner - orange or blue. A coin is tossed 20
times. A head is
We would expect these two outcomes to be equally likely because each colour
recorded 14 times,
sector is of the same size.
and a tail 6 times.
Find the experimental
and theoretical
The theoretical probability of
probabilities of
each outcome is 5 or 50%.
getting a head.
A dice is thrown
5 times. It gives a
However, these two outcomes may or may not be equally likely in a real-life
'four' 3 times. Find
situation. the experimental
and theorectical
18.3.2 Experimental probability probabilities of
getting a 'four'?
Max did an experiment to investigate whether the number of times the arrow
landed on the blue sector is equal to the number of times the arrow landed on
the orange sector.
Each time Max spins the
Max spun the spinner 40 times. He conducted 40 trials. spinner is called a trial.
He recorded his results on where the arrow landed.
Sector Frequency Experimental probability Frequency refers to the
number of times the
Orange 26
i =0.65 arrow lands on a colour
The experimental
sector.
Blue 14 ^ =0.35 probability should
add up to 1 or 100%
Total 40 1 * in percentage form.
In this experiment, the experimental probability tells us that the arrow landed on
the orange sector in 65% of the trials and on the blue sector in 35% of the trials.
Experimental probability = nomber of favourable outcomes
total number of trials
427