
Page 47 - Lecture Notes DCC3113
P. 47
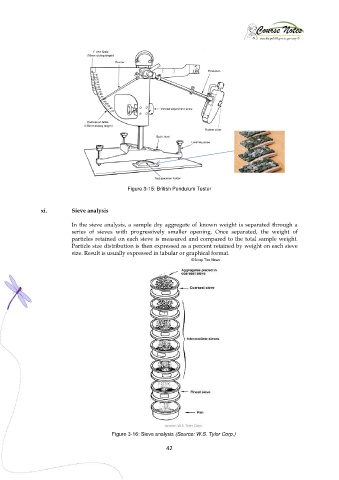
Figure 3-15: British Pendulum Tester


               xi.        Sieve analysis

                          In the  sieve analysis, a sample dry aggregate of  known weight is separated through a
                          series  of  sieves  with  progressively  smaller  opening.  Once  separated,  the  weight  of
                          particles retained on each sieve is measured and compared to the total sample weight.
                          Particle size distribution is then expressed as a percent retained by weight on each sieve
                          size. Result is usually expressed in tabular or graphical format.


                                        Figure 3-16: Sieve analysis (Source: W.S. Tylor Corp.)

                                                           42