
Page 208 - Jurnal Kurikulum BPK 2020
P. 208
catalyst for automaticity of lexical access in reading comprehension (Henriksen, 1999; Qian,
1999, 2000, 2002).
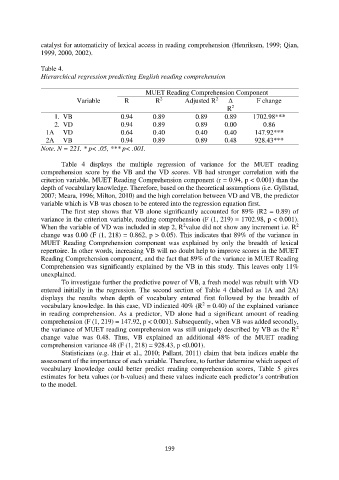
Table 4.
Hierarchical regression predicting English reading comprehension
MUET Reading Comprehension Component
2
2
Variable R R Adjusted R Δ F change
2
R
1. VB 0.94 0.89 0.89 0.89 1702.98***
2. VD 0.94 0.89 0.89 0.00 0.86
1A VD 0.64 0.40 0.40 0.40 147.92***
2A VB 0.94 0.89 0.89 0.48 928.43***
Note. N = 221. * p< .05, *** p< .001.
Table 4 displays the multiple regression of variance for the MUET reading
comprehension score by the VB and the VD scores. VB had stronger correlation with the
criterion variable, MUET Reading Comprehension component (r = 0.94, p < 0.001) than the
depth of vocabulary knowledge. Therefore, based on the theoretical assumptions (i.e. Gyllstad,
2007; Meara, 1996; Milton, 2010) and the high correlation between VD and VB, the predictor
variable which is VB was chosen to be entered into the regression equation first.
The first step shows that VB alone significantly accounted for 89% (R2 = 0.89) of
variance in the criterion variable, reading comprehension (F (1, 219) = 1702.98, p < 0.001).
2
2
When the variable of VD was included in step 2, R value did not show any increment i.e. R
change was 0.00 (F (1, 218) = 0.862, p > 0.05). This indicates that 89% of the variance in
MUET Reading Comprehension component was explained by only the breadth of lexical
repertoire. In other words, increasing VB will no doubt help to improve scores in the MUET
Reading Comprehension component, and the fact that 89% of the variance in MUET Reading
Comprehension was significantly explained by the VB in this study. This leaves only 11%
unexplained.
To investigate further the predictive power of VB, a fresh model was rebuilt with VD
entered initially in the regression. The second section of Table 4 (labelled as 1A and 2A)
displays the results when depth of vocabulary entered first followed by the breadth of
2
vocabulary knowledge. In this case, VD indicated 40% (R = 0.40) of the explained variance
in reading comprehension. As a predictor, VD alone had a significant amount of reading
comprehension (F (1, 219) = 147.92, p < 0.001). Subsequently, when VB was added secondly,
2
the variance of MUET reading comprehension was still uniquely described by VB as the R
change value was 0.48. Thus, VB explained an additional 48% of the MUET reading
comprehension variance 48 (F (1, 218) = 928.43, p <0.001).
Statisticians (e.g. Hair et al., 2010; Pallant, 2011) claim that beta indices enable the
assessment of the importance of each variable. Therefore, to further determine which aspect of
vocabulary knowledge could better predict reading comprehension scores, Table 5 gives
estimates for beta values (or b-values) and these values indicate each predictor’s contribution
to the model.
199