
Page 209 - Jurnal Kurikulum BPK 2020
P. 209
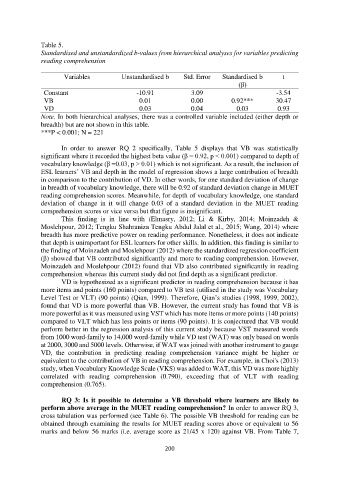
Table 5.
               Standardised and unstandardized b-values from hierarchical analyses for variables predicting
               reading comprehension

                       Variables            Unstandardised b      Std. Error   Standardised b       t
                                                                                     (β)
                Constant                         -10.91             3.09                          -3.54
                VB                                0.01              0.00          0.92***         30.47
                VD                                0.03              0.04            0.03          0.93
               Note. In both hierarchical analyses, there was a controlled variable included (either depth or
               breadth) but are not shown in this table.
               ***P < 0.001; N = 221

                       In  order  to  answer  RQ  2  specifically,  Table  5  displays  that  VB  was  statistically
               significant where it recorded the highest beta value (β = 0.92, p < 0.001) compared to depth of
               vocabulary knowledge (β =0.03, p > 0.01) which is not significant. As a result, the inclusion of
               ESL learners’ VB and depth in the model of regression shows a large contribution of breadth
               in comparison to the contribution of VD. In other words, for one standard deviation of change
               in breadth of vocabulary knowledge, there will be 0.92 of standard deviation change in MUET
               reading comprehension scores. Meanwhile, for depth of vocabulary knowledge, one standard
               deviation  of  change  in  it  will  change  0.03  of  a  standard  deviation  in  the  MUET  reading
               comprehension scores or vice versa but that figure is insignificant.
                       This  finding  is  in  line  with  (Elmasry,  2012;  Li  &  Kirby,  2014;  Moinzadeh  &
               Moslehpour, 2012; Tengku Shahraniza Tengku Abdul Jalal et al., 2015; Wang, 2014) where
               breadth has more predictive power on reading performance. Nonetheless, it does not indicate
               that depth is unimportant for ESL learners for other skills. In addition, this finding is similar to
               the finding of Moinzadeh and Moslehpour (2012) where the standardized regression coefficient
               (β) showed that VB contributed significantly and more to reading comprehension. However,
               Moinzadeh and Moslehpour (2012) found that VD also contributed significantly in reading
               comprehension whereas this current study did not find depth as a significant predictor.
                       VD is hypothesized as a significant predictor in reading comprehension because it has
               more items and points (160 points) compared to VB test (utilised in the study was Vocabulary
               Level Test or VLT) (90 points) (Qian, 1999). Therefore, Qian’s studies (1998, 1999, 2002),
               found that VD is more powerful than VB. However, the current study has found that VB is
               more powerful as it was measured using VST which has more items or more points (140 points)
               compared to VLT which has less points or items (90 points). It is conjectured that VB would
               perform better in the regression analysis of this current study because VST measured words
               from 1000 word-family to 14,000 word-family while VD test (WAT) was only based on words
               at 2000, 3000 and 5000 levels. Otherwise, if WAT was joined with another instrument to gauge
               VD,  the  contribution  in  predicting  reading  comprehension  variance  might  be  higher  or
               equivalent to the contribution of VB in reading comprehension. For example, in Choi's (2013)
               study, when Vocabulary Knowledge Scale (VKS) was added to WAT, this VD was more highly
               correlated  with  reading  comprehension  (0.790),  exceeding  that  of  VLT  with  reading
               comprehension (0.765).

                       RQ  3:  Is  it  possible  to  determine  a  VB  threshold  where  learners  are  likely  to
               perform above average in the MUET reading comprehension? In order to answer RQ 3,
               cross tabulation was performed (see Table 6). The possible VB threshold for reading can be
               obtained through examining the results for MUET reading scores above or equivalent to 56
               marks and below 56 marks (i.e. average score as 21/45 x 120) against VB. From Table 7,


                                                           200