Page 54 - 2018 Comprehensive Annual Financial Report - City of Winston-Salem
P. 54

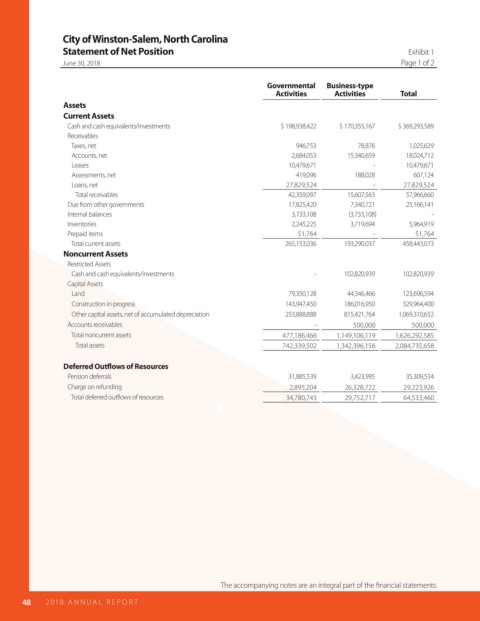
City of Winston-Salem, North Carolina
                       Statement of Net Position                                                               Exhibit 1
                       June 30, 2018                                                                         Page 1 of 2

                                                                           Governmental   Business-type
                                                                             Activities     Activities       Total
                       Assets
                       Current Assets
                          Cash and cash equivalents/investments               $ 198,938,422  $ 170,355,167  $ 369,293,589
                          Receivables
                             Taxes, net                                           946,753         78,876       1,025,629
                             Accounts, net                                       2,684,053     15,340,659     18,024,712
                             Leases                                             10,479,671            -       10,479,671
                             Assessments, net                                     419,096        188,028        607,124
                             Loans, net                                         27,829,524            -       27,829,524
                                Total receivables                               42,359,097     15,607,563     57,966,660
                          Due from other governments                            17,825,420      7,340,721     25,166,141
                          Internal balances                                      3,733,108      (3,733,108)          -
                          Inventories                                            2,245,225      3,719,694      5,964,919
                          Prepaid items                                            51,764             -          51,764
                             Total current assets                              265,153,036    193,290,037    458,443,073
                       Noncurrent Assets
                          Restricted Assets
                             Cash and cash equivalents/investments                     -      102,820,939    102,820,939
                          Capital Assets
                             Land                                               79,350,128     44,346,466    123,696,594
                             Construction in progress                          143,947,450    186,016,950    329,964,400
                             Other capital assets, net of accumulated depreciation  253,888,888  815,421,764  1,069,310,652
                          Accounts receivables                                         -         500,000        500,000
                             Total noncurrent assets                           477,186,466   1,149,106,119  1,626,292,585
                                Total assets                                   742,339,502   1,342,396,156  2,084,735,658

                       Deferred Out ows of Resources
                          Pension deferrals                                     31,885,539      3,423,995     35,309,534
                          Charge on refunding                                    2,895,204     26,328,722     29,223,926
                             Total deferred outflows of resources               34,780,743     29,752,717     64,533,460


                                                               The accompanying notes are an integral part of the  nancial statements.

            48    2018  AN NUAL  R E P O R T
   49   50   51   52   53   54   55   56   57   58   59