Page 85 - 2018 Comprehensive Annual Financial Report - City of Winston-Salem
P. 85

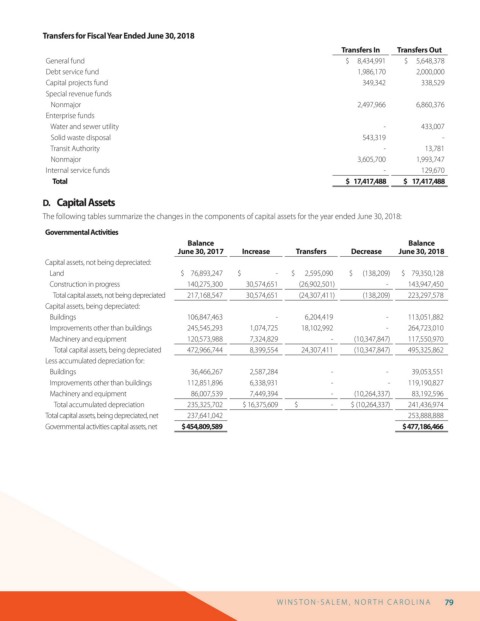
Transfers for Fiscal Year Ended June 30, 2018

                                                                                              Transfers In  Transfers Out
                  General fund                                                                 $     8,434,991    $     5,648,378
                  Debt service fund                                                               1,986,170      2,000,000
                  Capital projects fund                                                             349,342        338,529
                  Special revenue funds
                     Nonmajor                                                                     2,497,966      6,860,376
                  Enterprise funds
                     Water and sewer utility                                                             -         433,007
                     Solid waste disposal                                                           543,319             -
                     Transit Authority                                                                   -          13,781
                     Nonmajor                                                                     3,605,700      1,993,747
                  Internal service funds                                                                 -         129,670
                        Total                                                                   $   17,417,488    $     17,417,488

                 D.  Capital Assets
                 The following tables summarize the changes in the components of capital assets for the year ended June 30, 2018:

                  Governmental Activities
                                                       Balance                                                 Balance
                                                    June 30, 2017   Increase      Transfers     Decrease    June 30, 2018
                  Capital assets, not being depreciated:
                     Land                            $    76,893,247   $                     -   $      2,595,090   $      (138,209)   $    79,350,128
                     Construction in progress          140,275,300    30,574,651    (26,902,501)          -    143,947,450
                        Total capital assets, not being depreciated   217,168,547    30,574,651    (24,307,411)   (138,209)   223,297,578
                  Capital assets, being depreciated:
                     Buildings                         106,847,463            -      6,204,419            -    113,051,882
                     Improvements other than buildings   245,545,293    1,074,725    18,102,992           -    264,723,010
                     Machinery and equipment           120,573,988     7,324,829            -     (10,347,847)   117,550,970
                        Total capital assets, being depreciated   472,966,744    8,399,554    24,307,411    (10,347,847)   495,325,862
                  Less accumulated depreciation for:
                     Buildings                          36,466,267     2,587,284            -             -     39,053,551
                     Improvements other than buildings   112,851,896    6,338,931           -             -    119,190,827
                     Machinery and equipment            86,007,539     7,449,394            -     (10,264,337)   83,192,596
                        Total accumulated depreciation   235,325,702    $ 16,375,609    $                      -    $ (10,264,337)   241,436,974
                  Total capital assets, being depreciated, net   237,641,042                                   253,888,888
                  Governmental activities capital assets, net   $ 454,809,589                                 $ 477,186,466


                                                                             W I N S T O N   S AL E M ,  N O R T H  C AR O L I N A  79
   80   81   82   83   84   85   86   87   88   89   90