
Page 160 - Color_Atlas_of_Physiology_5th_Ed._-_A._Despopoulos_2003
P. 160
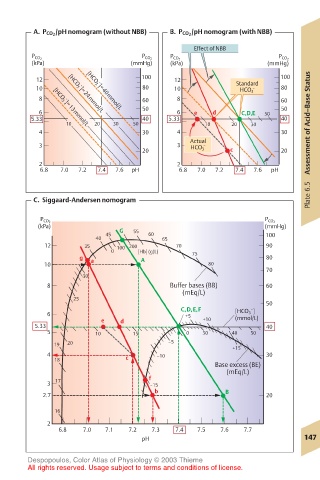
A.  P CO 2 /pH nomogram (without NBB)  B.  P CO 2 /pH nomogram (with NBB)
                                             Effect of NBB
        P CO 2                   P CO 2  P CO 2                 P CO 2
        (kPa)                 (mmHg)   (kPa)                 (mmHg)
         12                      100    12                      100
                       –                              Standard
         10        –  [HCO 3 ]=40mmol/L  80  10        HCO 3 –  80
          8     –  [HCO 3 ]=24mmol/L  60  8                     60
                                 50                             50
          6                              6   e   d     C,D,E  50
        5.33                     40    5.33                     40
                10    20  30   50              10    20  30            Assessment of Acid–Base Status
             [HCO 3 ]=13mmol/L
          4                      30      4                      30
                                            Actual
          3                              3     –
                                 20         HCO 3    c          20
          2                              2
          6.8  7.0  7.2  7.4  7.6  pH    6.8  7.0  7.2  7.4  7.6  pH
                                                                       Plate 6.5
         C.  Siggaard-Andersen nomogram

          P CO 2                                             P CO 2
          (kPa)                                              (mmHg)
                         45  G  55  60                       100
                       40             65
           12       35     100 200       70                  90
                          0     [Hb] (g/L)  75
                   g             A                           80
           10        a                          80
                                                             70
                    30
            8                          Buffer bases (BB)     60
                                          (mEq/L)
                  25
                                                             50
                                          C,D,E,F     [HCO 3 ]
                                                         –
            6                              +5
                        e   d                  +10    (mmol/L)
         5.33                                                40
            5         10       15          0   30    40  50
             19  20                    –5
                                                     +15
            4                       –10                      30
             18              c
                                                 Base excess (BE)
                                                    (mEq/L)
                                   f
             17
            3                      –15
                                    b               B
           2.7                                               20
             16
            2
              6.8   7.0  7.1  7.2  7.3  7.4  7.5   7.6  7.7
                                 pH                                  147
       Despopoulos, Color Atlas of Physiology © 2003 Thieme
       All rights reserved. Usage subject to terms and conditions of license.