
Page 159 - Color_Atlas_of_Physiology_5th_Ed._-_A._Despopoulos_2003
P. 159
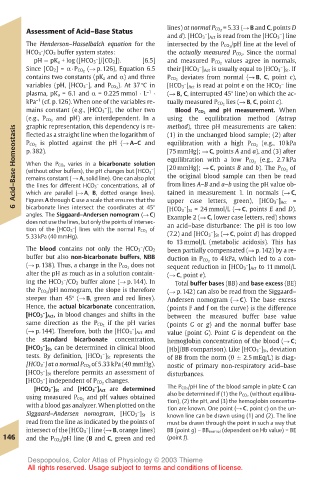
Assessment of Acid–Base Status  lines) at normal P CO 2 = 5.33 (! B and C, points D
                                               –
                                       and d). [HCO 3 ] Act is read from the [HCO 3 ] line
                                                                –
       The Henderson–Hasselbalch equation for the  intersected by the P CO 2 /pH line at the level of
          –
       HCO 3 /CO 2 buffer system states:  the actually measured P CO 2 . Since the normal
                       –
         pH ! pK a + log ([HCO 3 ]/[CO 2]).  [6.5]  and measured P CO 2 values agree in normals,
                                              –
       Since [CO 2] = α · P CO 2 (! p. 126), Equation 6.5  their [HCO 3 ] Act is usually equal to [HCO 3 ] St. If
                                                                –
       contains two constants (pK a and α) and three  P CO 2 deviates from normal (! B, C, point c),
                                          –
                    –
                                                                –
       variables (pH, [HCO 3 ], and P CO 2 ). At 37 "C in  [HCO 3 ] Act is read at point e on the HCO 3 line
       plasma, pK a = 6.1 and α = 0.225 mmol · L –1  ·  (! B, C, interrupted 45" line) on which the ac-
         –1
       kPa (cf. p. 126). When one of the variables re-  tually measured P CO 2 lies (! B, C, point c).
       mains constant (e.g., [HCO 3 ]), the other two  Blood P CO 2 and pH measurement. When
                         –
       (e.g., P CO 2 and pH) are interdependent. In a  using  the  equilibration  method  (Astrup
       graphic representation, this dependency is re-
                                       method), three pH measurements are taken:
    Acid–Base Homeostasis  P CO 2 is plotted against the pH (! A–C and  equilibration with a high P CO 2 (e.g., 10 kPa
       flected as a straight line when the logarithm of
                                       (1) in the unchanged blood sample; (2) after
                                       [75 mmHg]; ! C, points A and a), and (3) after
       p. 382).
                                       equilibration with a low P CO 2 (e.g., 2.7 kPa
       When the P CO 2 varies in a bicarbonate solution
                                       [20 mmHg]; ! C, points B and b). The P CO 2 of
                                   –
       (without other buffers), the pH changes but [HCO 3 ]
                                       the original blood sample can then be read
       remains constant ( ! A, solid line). One can also plot
                                       from lines A–B and a–b using the pH value ob-
                       –
       the lines for different HCO 3 concentrations, all of
       which are parallel (! A, B, dotted orange lines).
                                                               –
                                       upper case letters, green), [HCO 3 ] Act
    6  Figures A through C use a scale that ensures that the  tained in measurement 1. In normals (! C, =
                                       [HCO 3 ] St = 24 mmol/L (! C, points E and D).
       bicarbonate lines intersect the coordinates at 45"
                                          –
       angles. The Siggaard–Andersen nomogram (! C)  Example 2 (! C, lower case letters, red) shows
       does not use the lines, but only the points of intersec-  an acid–base disturbance: The pH is too low
                 –
       tion of the [HCO 3 ] lines with the normal P CO 2 of
                                                –
       5.33 kPa (40 mmHg).             (7.2) and [HCO 3 ] St (! C, point d) has dropped
                                       to 13 mmol/L (metabolic acidosis). This has
                                 –
       The blood contains not only the HCO 3 /CO 2  been partially compensated (! p. 142) by a re-
       buffer but also non-bicarbonate buffers, NBB  duction in P CO 2 to 4 kPa, which led to a con-
       (! p. 138). Thus, a change in the P CO 2 does not  sequent reduction in [HCO 3 ] Act to 11 mmol/L
                                                        –
       alter the pH as much as in a solution contain-  (! C, point e).
               –
       ing the HCO 3 /CO 2 buffer alone (! p. 144). In  Total buffer bases (BB) and base excess (BE)
       the P CO 2 /pH nomogram, the slope is therefore  (! p. 142) can also be read from the Siggaard–
       steeper than 45" (! B, green and red lines).  Andersen nomogram (! C). The base excess
       Hence, the actual bicarbonate concentration,  (points F and f on the curve) is the difference
       [HCO 3 ] Act, in blood changes and shifts in the  between the measured buffer base value
           –
       same direction as the P CO 2 if the pH varies  (points G or g) and the normal buffer base
                               –
       (! p. 144). Therefore, both the [HCO 3 ] Act and  value (point G). Point G is dependent on the
       the  standard  bicarbonate  concentration,  hemoglobin concentration of the blood (! C;
           –
       [HCO 3 ] St, can be determined in clinical blood  [Hb]/BB comparison). Like [HCO 3 ] St, deviation
                                                           –
       tests. By definition, [HCO 3 ] St represents the  of BB from the norm (0 # 2.5 mEq/L) is diag-
                        –
           –
       [HCO 3 ] at a normal P CO 2 of 5.33 kPa (40 mmHg).  nostic of primary non-respiratory acid–base
           –
       [HCO 3 ] St therefore permits an assessment of  disturbances.
           –
       [HCO 3 ] independent of P CO 2 changes.
            –
                      –
         [HCO 3 ] St and [HCO 3 ] Act are determined  The P CO 2 /pH line of the blood sample in plate C can
       using measured P CO 2 and pH values obtained  also be determined if (1) the P CO 2 (without equilibra-
                                       tion), (2) the pH, and (3) the hemoglobin concentra-
       with a blood gas analyzer. When plotted on the  tion are known. One point (! C, point c) on the un-
                                –
       Siggaard–Andersen nomogram, [HCO 3 ] St is  known line can be drawn using (1) and (2). The line
       read from the line as indicated by the points of  must be drawn through the point in such a way that
       intersect of the [HCO 3 ] line (! B, orange lines)  BB (point g) – BB normal (dependent on Hb value) = BE
                    –
  146  and the P CO 2 /pH line (B and C, green and red  (point f).
       Despopoulos, Color Atlas of Physiology © 2003 Thieme
       All rights reserved. Usage subject to terms and conditions of license.