
Page 367 - Color_Atlas_of_Physiology_5th_Ed._-_A._Despopoulos_2003
P. 367
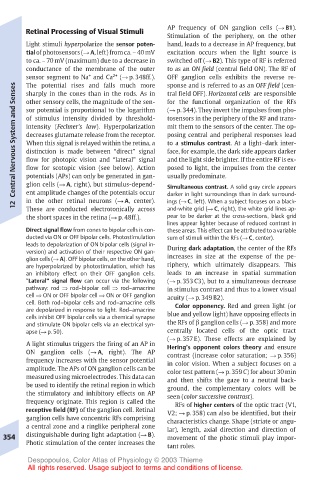
Retinal Processing of Visual Stimuli  AP frequency of ON ganglion cells (! B1).
                                       Stimulation of the periphery, on the other
       Light stimuli hyperpolarize the sensor poten-  hand, leads to a decrease in AP frequency, but
       tial of photosensors (! A, left) from ca. – 40 mV  excitation occurs when the light source is
       to ca. – 70 mV (maximum) due to a decrease in  switched off (! B2). This type of RF is referred
       conductance of the membrane of the outer  to as an ON field (central field ON). The RF of
                     +
       sensor segment to Na and Ca 2+  (! p. 348ff.).  OFF ganglion cells exhibits the reverse re-
                                       sponse and is referred to as an OFF field (cen-
       The potential rises and falls much more
    Central Nervous System and Senses  sor potential is proportional to the logarithm  (! p. 344). They invert the impulses from pho-
       sharply in the cones than in the rods. As in
                                       tral field OFF). Horizontal cells are responsible
                                       for the functional organization of the RFs
       other sensory cells, the magnitude of the sen-
       of stimulus intensity divided by threshold-
                                       tosensors in the periphery of the RF and trans-
       intensity (Fechner’s law). Hyperpolarization
                                       mit them to the sensors of the center. The op-
       decreases glutamate release from the receptor.
                                       posing central and peripheral responses lead
       When this signal is relayed within the retina, a
                                       to a stimulus contrast. At a light–dark inter-
       distinction is made between “direct” signal
                                       face, for example, the dark side appears darker
                                       and the light side brighter. If the entire RF is ex-
       flow for photopic vision and “lateral” signal
       flow for scotopic vision (see below). Action
                                       posed to light, the impulses from the center
       glion cells (! A, right), but stimulus-depend-
                                       Simultaneous contrast. A solid gray circle appears
       ent amplitude changes of the potentials occur
                                       darker in light surroundings than in dark surround-
       in the other retinal neurons (! A, center).
                                       ings (! C, left). When a subject focuses on a black-
    12  potentials (APs) can only be generated in gan-  usually predominate.
       These are conducted electrotonically across
                                       and-white grid (! C, right), the white grid lines ap-
       the short spaces in the retina (! p. 48ff.).  pear to be darker at the cross-sections, black grid
                                       lines appear lighter because of reduced contrast in
       Direct signal flow from cones to bipolar cells is con-  these areas. This effect can be attributed to a variable
       ducted via ON or OFF bipolar cells. Photostimulation  sum of stimuli within the RFs (! C, center).
       leads to depolarization of ON bipolar cells (signal in-
       version) and activation of their respective ON gan-  During dark adaptation, the center of the RFs
       glion cells (! A). OFF bipolar cells, on the other hand,  increases in size at the expense of the pe-
       are hyperpolarized by photostimulation, which has  riphery, which ultimately disappears. This
       an inhibitory effect on their OFF ganglion cells.  leads to an increase in spatial summation
       ”Lateral” signal flow can occur via the following  (! p. 353 C3), but to a simultaneous decrease
       pathway: rod ! rod–bipolar cell ! rod–amacrine  in stimulus contrast and thus to a lower visual
       cell ! ON or OFF bipolar cell ! ON or OFF ganglion  acuity (! p. 349 B2).
       cell. Both rod–bipolar cells and rod–amacrine cells  Color opponency. Red and green light (or
       are depolarized in response to light. Rod–amacrine
       cells inhibit OFF bipolar cells via a chemical synapse  blue and yellow light) have opposing effects in
       and stimulate ON bipolar cells via an electrical syn-  the RFs of ! ganglion cells (! p. 358) and more
       apse (! p. 50).                 centrally located cells of the optic tract
                                       (! p. 357 E). These effects are explained by
       A light stimulus triggers the firing of an AP in  Hering’s opponent colors theory and ensure
       ON ganglion cells (! A, right). The AP  contrast (increase color saturation; ! p. 356)
       frequency increases with the sensor potential  in color vision. When a subject focuses on a
       amplitude. The APs of ON ganglion cells can be  color test pattern (! p. 359 C) for about 30 min
       measured using microelectrodes. This data can  and then shifts the gaze to a neutral back-
       be used to identify the retinal region in which  ground, the complementary colors will be
       the stimulatory and inhibitory effects on AP  seen (color successive contrast).
       frequency originate. This region is called the  RFs of higher centers of the optic tract (V1,
       receptive field (RF) of the ganglion cell. Retinal  V2; ! p. 358) can also be identified, but their
       ganglion cells have concentric RFs comprising  characteristics change. Shape (striate or angu-
       a central zone and a ringlike peripheral zone  lar), length, axial direction and direction of
  354  distinguishable during light adaptation (! B).  movement of the photic stimuli play impor-
       Photic stimulation of the center increases the
                                       tant roles.
       Despopoulos, Color Atlas of Physiology © 2003 Thieme
       All rights reserved. Usage subject to terms and conditions of license.