
Page 117 - Hall et al (2015) Principles of Critical Care-McGraw-Hill
P. 117
CHAPTER 13: Assessment of Severity of Illness 85
100% poorer the reliability of the system. Intraobserver reliability can be mea-
sured using a variety of techniques, and is expressed on a range between
90% 0 (measurement involves nothing but error) and 1 (no variable error). A
reliability coefficient of greater than 0.7 (suggesting that no more than 30%
80% of the score is due to error) has been used as a statistical standard of rea-
True positive rate (sensitivity) (%) 60% A Mortality is dependent not only on measured physiologic derangements
sonable relaibility. The kappa statistic measures interobserver reliability.
14
70%
Content validity reflects the comprehensiveness of the model.
14
and underlying health status, but may also be influenced by factors that
are difficult to quantify, such as duration of organ system failure before
50%
treatment was instituted, staffing of an ICU, time of day of admission to
https://kat.cr/user/tahir99/
ICU, and whether the admission was planned or unplanned, among oth-
40%
ers. In general, as the number of variables increase in a scoring system, the
30%
be inclusion of more variables that are easily collated from the large com-
20% B reliability and ease of capturing the data decrease. The exception would
puterized clinical information systems used in most ICUs. In other words,
C
this computerization of ICU variables could decrease the complexity pro-
10% D duced by use of large numbers of patient variables in a severity of illness
scoring system. Also, recording errors and transcription errors can be
0%
0% 10% 20% 30% 40% 50% 60% 70% 80% 90% 100% decreased by ICU computerization driving the data for severity of illness
False positive rate (1-specificity) (%) scoring systems. Nonetheless, the inclusion of many variables (overfit-
ting) may actually reduce the performance of the model because some of
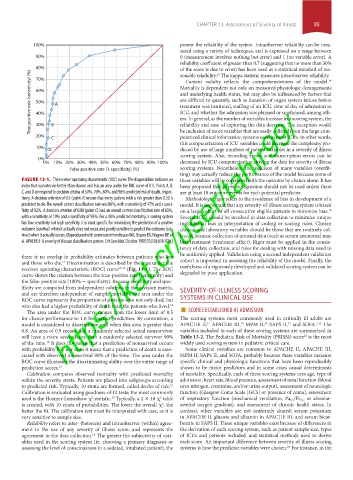
FIGURE 13-1. The receiver operating characteristic (ROC) curve. The diagonal line indicates an these variables will be correlated with the outcome by chance alone. It has
index that operates no better than chance and has an area under the ROC curve of 0.5. Points A, B, been proposed that stepwise regression should not be used unless there
C, and D correspond to decision criteria of 50%, 70%, 80%, and 90% predicted risk of death, respec- are at least 10 outcome events for each potential predictor.
tively. A decision criterion of 0.5 (point A) means that every patient with a risk greater than 0.50 is Methodologic rigor refers to the avoidance of bias in development of a
predicted to die. The overall correct classification rate was 86%, with a sensitivity of 47% and a speci- model. It is important that any severity-of-illness scoring system is based
ficity of 92%. A decision criterion of 0.80 (point C) had an overall correct classification rate of 83%, on a large cohort of all consecutive eligible patients to minimize bias.
14
with a sensitivity of 19% and a specificity of 93%. For a 90% predicted mortality, a scoring system Several ICUs should be involved in data collection to minimize unique
has low sensitivity but high specificity. It is most specific for minimizing the prediction of a positive institutional bias in interpretation of coding or scoring rules. Chosen
outcome (survival) when it actually does not occur, and poorly sensitive to predict the outcome (sur- clinical and laboratory variables should be those that are routinely col-
vival) when it actually occurs. (Reproduced with permission from Knaus WA, Draper EA, Wagner DP, et lected, because collection of unusual data (such as serum ammonia) may
al. APACHE II: A severity of disease classification system. Crit Care Med. October 1985;13(10):818-829.) bias treatment (treatment effect). Rigor must be applied in the consis-
tency of data collection, and rules for dealing with missing data need to
be uniformly applied. Validation using a second independent validation
there is no overlap in probability estimates between patients who live
and those who die. Discrimination is described by the area under the cohort is important in assessing the reliability of the model. Finally, the
15
receiver operating characteristic (ROC) curve 15,16 (Fig. 13-1). The ROC usefulness of a rigorously developed and validated scoring system can be
curve shows the relation between the true-positive rate (sensitivity) and degraded by poor application.
the false-positive rate (100% - specificity). Because sensitivity and spec-
ificity are computed from independent columns in the decision matrix,
and are therefore independent of sample mortality, the area under the SEVERITY-OF-ILLNESS SCORING
ROC curve represents the proportion of patients who not only died, but SYSTEMS IN CLINICAL USE
The area under the ROC curve ranges from the lower limit of 0.5 ■
who also had a higher probability of death than the patients who lived. 14 SCORES ESTABLISHED AT ADMISSION
for chance performance to 1.0 for perfect prediction. By convention, a The scoring systems most commonly used in critically ill adults are
21
7,22
17
model is considered to discriminate well when this area is greater than APACHE II, APACHE III, MPM II, SAPS II, and SOFA. The
19
20
0.8. An area of 0.9 means that a randomly selected actual nonsurvivor variables included in each of these scoring systems are summarized in
will have a more severe score than a randomly selected survivor 90% Table 13-2. The Pediatric Risk of Mortality (PRISM) score is the most
23
of the time. It does not mean that a prediction of nonsurvival occurs widely used scoring system in pediatric critical care.
12
with probability 0.9, nor does it mean that a prediction of death is asso- Some clinical variables are common to APACHE II, APACHE III,
ciated with observed nonsurvival 90% of the time. The area under the MPM II, SAPS II, and SOFA, probably because these variables measure
ROC curve illustrates the discriminating ability over the entire range of specific clinical and physiologic functions that have been reproducibly
prediction scores. 15 shown to be major predictors and in some cases causal determinants
Calibration compares observed mortality with predicted mortality of mortality. Specifically, each of these scoring systems uses age, type of
within the severity strata. Patients are placed into subgroups according admission, heart rate, blood pressure, assessment of renal function (blood
to predicted risk. Typically, 10 strata are formed, called deciles of risk. urea nitrogen, creatinine, and/or urine output), assessment of neurologic
15
Calibration is evaluated using goodness-of-fit tests; the most commonly function (Glasgow Coma Scale [GCS] or presence of coma), assessment
used is the Hosmer-Lemeshow χ statistic. Typically, a 2 × 10 χ table of respiratory function (mechanical ventilation, Pa O 2 /Fi O 2 , or alveolar-
18
2
2
2
is created, with 10 strata of probabilities. The lower the overall χ , the arterial oxygen gradient), and assessment of chronic health status. In
better the fit. The calibration test must be interpreted with care, as it is contrast, other variables are not uniformly shared: serum potassium
very sensitive to sample size. in APACHE II, glucose and albumin in APACHE III, and serum bicar-
Reliability refers to inter- (between) and intraobserver (within) agree- bonate in SAPS II. These unique variables exist because of differences in
ment in the use of any severity of illness score, and represents the the derivation of each scoring system, such as patient sample size, types
agreement in the data collection. The greater the subjectivity of vari- of ICUs and patients included, and statistical methods used to derive
14
ables used in the scoring system (ie, choosing a primary diagnosis or each score. An important difference between severity of illness scoring
assessing the level of consciousness in a sedated, intubated patient), the systems is how the predictor variables were chosen. For instance, in the
24
Section01.indd 85 1/22/2015 9:37:24 AM