
Page 283 - Hall et al (2015) Principles of Critical Care-McGraw-Hill
P. 283
CHAPTER 28: Interpretation of Hemodynamic Waveforms 187
test can be used to make a more precise assessment of the dynamic
A B
response characteristics. 22
For the hydraulic monitoring system to display accurate pressures, it
is essential that the system is first zeroed with the transducer exposed
to atmospheric pressure. The air-fluid interface of the monitoring
system (ie, the stopcock attached to the transducer) is then placed at
the phlebostatic axis (the midpoint between the most anterior and
FIGURE 28-1. Rapid-flush test. A. Appropriately damped system. B. Overdamped system.
posterior aspects of the chest in the fourth intercostal space) with the
patient supine. Alternatively, the transducer can be placed 5 cm below
and a signal-processing unit that conditions and amplifies this electri- the sternal notch with the aid of a carpenter’s level. Movement of
23
cal signal for display. Two primary features of the pressure monitoring the transducer relative to the heart will cause the recorded pressure to
system determine its dynamic response properties: natural resonant underestimate or overestimate the true value (Fig. 28-2).
frequency and damping coefficient. 20-22 Once perturbed, each catheter-
transducer system tends to oscillate at a unique (natural resonant) fre- PRESSURE WAVEFORMS
quency determined by the elasticity and capacitance of its deformable
elements. An undamped system responds well to the low-frequency The CVC permits measurement of a single intravascular pressure
components of a complex waveform, but it exaggerates the amplitude (CVP) that is recorded after catheter insertion. In contrast, the properly
of components near the resonant value. Modest damping is desirable placed PAC provides pressure data from three sites and insertion is
for optimal fidelity and for suppression of unwanted high-frequency guided by transitions in the pressure waveform as the inflated catheter
vibration (noise); however, excessive damping smoothens the tracing is advanced. Before discussing characteristics of normal and pathologic
unnaturally and eliminates important frequency components of the hemodynamic waveforms, waveform-guided insertion of the PAC will
pressure waveform. be briefly addressed.
Overdamping due to air bubbles, clots, fibrin, or kinks diminish trans- The PAC has two lumens for pressure recording: a distal lumen and
mission of the pulsatile pressure waveform to the transducer, resulting a proximal lumen that opens 30 cm from the catheter tip. A single pres-
in a decrease in systolic pressure and an increase in diastolic pressure. A sure transducer is connected to the distal port, and the proximal port is
simple bedside test for overdamping is the “rapid flush” test. Because connected to a separate infusion of intravenous fluid (Fig. 28-3). Use of a
20
of the length and small gauge of the catheter, very high pressures are “bridge” and stopcocks permits right atrial pressure (Pra) to be recorded
generated near the transducer when the flush device is opened. With from the proximal lumen after catheter insertion. Stopcocks should be
sudden closure of the flush device, an appropriately damped system will checked before insertion to be sure that the monitor displays pressure from
show a rapid fall in pressure with an overshoot followed by a prompt the distal lumen. Inadvertent recording from the proximal lumen should
return to a crisp pressure tracing, giving a “square wave” appearance. be suspected if during insertion the displayed pressure is initially near zero
In contrast, an overdamped system has a gradual return to the baseline and then suddenly increases as the proximal lumen enters the introducer,
pressure without an overshoot (Fig. 28-1). Although less common, an or if there is ventricular ectopy while the monitor displays a Pra waveform,
underdamped system can lead to significant systolic overshoot with indicating that the catheter tip is in the right ventricle (RV) (Fig. 28-4).
overestimation of systolic pressure. To give optimal performance, the Once the catheter tip has passed through the introducer (15-20 cm), the
system should (1) be free of bubbles, kinks, and clots, (2) avoid exces- balloon is inflated and the PAC is advanced into the RV (Fig. 28-5). After
sive tubing length (<48 in), and (3) have the minimal possible number entering the RV, insertion of an additional 10 to 15 cm of catheter is usually
of stopcocks. Simple visual inspection of the response to the rapid sufficient to reach the pulmonary artery. Feeding excessive catheter while
flush test is most often used to determine if the pressure monitoring the tip remains in the RV can lead to coiling and possible knotting. The
system is acceptable. However, a paper strip recording of the rapid flush pulmonary artery pressure tracing (Ppa) is evidenced by an abrupt rise in
diastolic pressure (Fig. 28-5). With further advancement, a fall in mean
pressure and transition to an atrial waveform (see below) signals transition to
Ppw 4 mm Hg a pulmonary artery occlusion (wedge) pressure (Ppw) (Fig. 28-5).
Several factors can hinder analysis of pressure waveforms during
PAC insertion. Large swings in intrathoracic pressure due to vigorous
respiratory effort may create difficulty with waveform interpretation.
24
If the patient is mechanically ventilated, sedation (or even temporary
10 cm
paralysis) to reduce respiratory excursions may aid interpretation and
will enhance reliability of the measurements obtained. 25,26 Another
problem is excessive catheter “whip” caused by “shock transients” being
transmitted to the catheter during RV contraction in hyperdynamic
Ppw 12 mm Hg
12 states (Fig. 28-6). Finally, an overdamped system (see above) may make
it more difficult to discern transitions in pressure waveforms.
■ RIGHT ATRIAL PRESSURE
10 cm
Right atrial pressure (Pra) is measured from either the distal lumen of the
CVC or the proximal port of the PAC. (The CVP and Pra are equivalent
and the latter designation will be used in the remainder of this chapter). The
Pra is most often used to assess intravascular volume status, but character-
Ppw 20 mm Hg
istics of the Pra waveform can also aid in the diagnosis of certain cardiac
(and pericardial) disorders, including arrhythmias. For both purposes, it
is important to appreciate the characteristics of the normal Pra waveform.
In sinus rhythm, the Pra waveform is characterized by two major
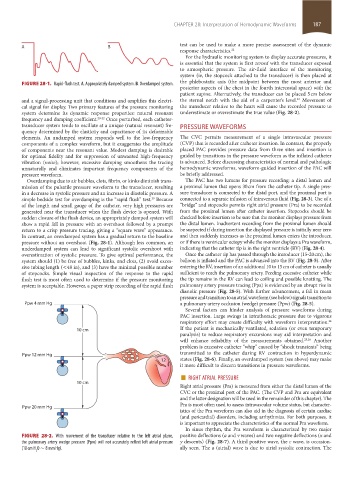
FIGURE 28-2. With movement of the transducer relative to the left atrial plane, positive deflections (a and v waves) and two negative deflections (x and
the pulmonary artery wedge pressure (Ppw) will not accurately reflect left atrial pressure y descents) (Fig. 28-7). A third positive wave, the c wave, is occasion-
(10 cm H O ∼ 8 mm Hg). ally seen. The a (atrial) wave is due to atrial systolic contraction. The
2
section02.indd 187 1/13/2015 2:05:26 PM