
Page 288 - Hall et al (2015) Principles of Critical Care-McGraw-Hill
P. 288
192 PART 2: General Management of the Patient
pulmonary vasculature and a longer length of catheter. Therefore, in the
Ppw tracing, the a wave usually appears after the QRS complex, and
the v wave is seen after the T wave (see Fig. 28-7). When referenced
to the ECG, the v wave of the Ppw tracing occurs later than the Ppa
systolic pressure wave. An appreciation of the latter concept is critical
when tracings are being analyzed to ensure that balloon inflation has
resulted in an acceptable transition from Ppa to Ppw and to detect the
j point presence of a “giant” v wave in the Ppw tracing (see below).
For the Ppw to accurately represent Pla, it is essential that the tip of
A the inflated catheter lie free within the vessel lumen. Obstruction to flow
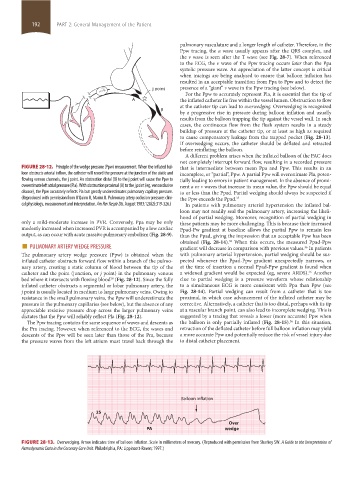
at the catheter tip can lead to overwedging. Overwedging is recognized
B
by a progressive rise in pressure during balloon inflation and usually
results from the balloon trapping the tip against the vessel wall. In such
cases, the continuous flow from the flush system results in a steady
buildup of pressure at the catheter tip, or at least as high as required
to cause compensatory leakage from the trapped pocket (Fig. 28-13).
If overwedging occurs, the catheter should be deflated and retracted
before reinflating the balloon.
A different problem arises when the inflated balloon of the PAC does
not completely interrupt forward flow, resulting in a recorded pressure
FIGURE 28-12. Principle of the wedge pressure (Ppw) measurement. When the inflated bal- that is intermediate between mean Ppa and Ppw. This results in an
loon obstructs arterial inflow, the catheter will record the pressure at the junction of the static and incomplete, or “partial”, Ppw. A partial Ppw will overestimate Pla, poten-
flowing venous channels, the j point. An obstruction distal (B) to the j point will cause the Ppw to tially leading to errors in patient management. In the absence of promi-
overestimate left atrial pressure (Pla). With obstruction proximal (A) to the j point (eg, venoocclusive nent a or v waves that increase its mean value, the Ppw should be equal
disease), the Ppw accurately reflects Pla but greatly underestimates pulmonary capillary pressure. to or less than the Ppad. Partial wedging should always be suspected if
(Reproduced with permission from O’Quinn R, Marini JJ. Pulmonary artery occlusion pressure: clini- the Ppw exceeds the Ppad. 35
cal physiology, measurement and interpretation. Am Rev Respir Dis. August 1983;128(2):319-326.) In patients with pulmonary arterial hypertension the inflated bal-
loon may not readily seal the pulmonary artery, increasing the likeli-
hood of partial wedging. Moreover, recognition of partial wedging in
only a mild-moderate increase in PVR. Conversely, Ppa may be only these patients may be more challenging. This is because their increased
modestly increased when increased PVR is accompanied by a low cardiac Ppad-Pw gradient at baseline allows the partial Ppw to remain less
output, as can occur with acute massive pulmonary embolism (Fig. 28-9). than the Ppad, giving the impression that an acceptable Ppw has been
■ PULMONARY ARTERY WEDGE PRESSURE obtained (Fig. 28-14). When this occurs, the measured Ppad-Ppw
36
gradient will decrease in comparison with previous values. In patients
36
The pulmonary artery wedge pressure (Ppw) is obtained when the with pulmonary arterial hypertension, partial wedging should be sus-
inflated catheter obstructs forward flow within a branch of the pulmo- pected whenever the Ppad-Ppw gradient unexpectedly narrows, or
nary artery, creating a static column of blood between the tip of the at the time of insertion a normal Ppad-Ppw gradient is found when
catheter and the point (junction, or j point) in the pulmonary venous a widened gradient would be expected (eg, severe ARDS). Another
36
bed where it intersects with flowing blood (Fig. 28-12). Since the fully clue to partial wedging is a pressure waveform whose relationship
20
inflated catheter obstructs a segmental or lobar pulmonary artery, the to a simultaneous ECG is more consistent with Ppa than Ppw (see
j point is usually located in medium to large pulmonary veins. Owing to Fig. 28-14). Partial wedging can result from a catheter that is too
resistance in the small pulmonary veins, the Ppw will underestimate the proximal, in which case advancement of the inflated catheter may be
pressure in the pulmonary capillaries (see below), but the absence of any corrective. Alternatively, a catheter that is too distal, perhaps with its tip
appreciable resistive pressure drop across the larger pulmonary veins at a vascular branch point, can also lead to incomplete wedging. This is
dictates that the Ppw will reliably reflect Pla (Fig. 28-12). suggested by a tracing that reveals a lower (more accurate) Ppw when
The Ppw tracing contains the same sequence of waves and descents as the balloon is only partially inflated (Fig. 28-15). In this situation,
36
the Pra tracing. However, when referenced to the ECG, the waves and retraction of the deflated catheter before full balloon inflation may yield
descents of the Ppw will be seen later than those of the Pra, because a more accurate Ppw and potentially reduce the risk of vessel injury due
the pressure waves from the left atrium must travel back through the to distal catheter placement.
Balloon inflation
25
Over
PA wedge
FIGURE 28-13. Overwedging. Arrow indicates time of balloon inflation. Scale in millimeters of mercury. (Reproduced with permission from Sharkey SW. A Guide to the Interpretation of
Hemodynamic Data in the Coronary Care Unit. Philadelphia, PA: Lippincott-Raven; 1997.)
section02.indd 192 1/13/2015 2:05:33 PM