Page 285 - Hall et al (2015) Principles of Critical Care-McGraw-Hill
P. 285

CHAPTER 28: Interpretation of Hemodynamic Waveforms  189


                                                          II            II            II
                                                           1 mV         1 mV          1 mV
                                                            RV           PA
                                                                                      Wedge
                                             II
                                                              60            60            60
                                             1 mV
                                             RA

                                                30            30            30            30


                                                 0             0            0              0
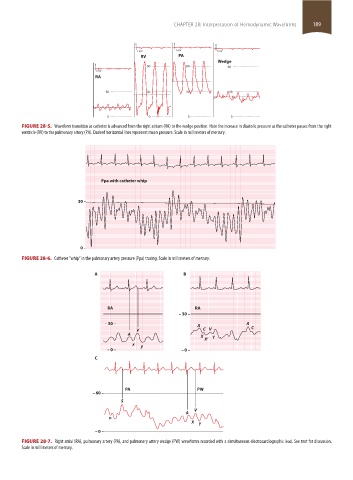
                    FIGURE 28-5.  Waveform transition as catheter is advanced from the right atrium (RA) to the wedge position. Note the increase in diastolic pressure as the catheter passes from the right
                    ventricle (RV) to the pulmonary artery (PA). Dashed horizontal lines represent mean pressure. Scale in millimeters of mercury.


                                               Ppa with catheter whip


                                       30 –


                                        0 –
                    FIGURE 28-6.  Catheter “whip” in the pulmonary artery pressure (Ppa) tracing. Scale in millimeters of mercury.

                                             A                             B


                                                 RA                            RA
                                                                         – 30 –
                                                – 30 –                          A               A
                                                           V                     CV               C
                                                        A                        X
                                                                                  X’  Y
                                                         x  y
                                                 – 0 –                    – 0 –
                                             C


                                                       PA                      PW
                                            – 60 –
                                                     S
                                                                              V
                                                                            A
                                                 n
                                                                             X  Y
                                             – 0 –
                    FIGURE 28-7.  Right atrial (RA), pulmonary artery (PA), and pulmonary artery wedge (PW) waveforms recorded with a simultaneous electrocardiographic lead. See text for discussion.
                    Scale in millimeters of mercury.


            section02.indd   189                                                                                       1/13/2015   2:05:30 PM
   280   281   282   283   284   285   286   287   288   289   290