
Page 286 - Hall et al (2015) Principles of Critical Care-McGraw-Hill
P. 286
190 PART 2: General Management of the Patient
Pra
20
a v
c
y
x
0 Inspiration
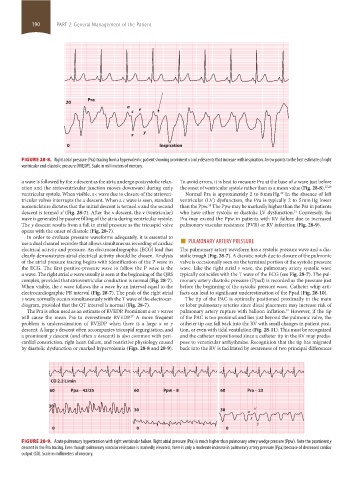
FIGURE 28-8. Right atrial pressure (Pra) tracing from a hypervolemic patient showing prominent x and y descents that increase with inspiration. Arrow points to the best estimate of right
ventricular end-diastolic pressure (RVEDP). Scale in millimeters of mercury.
a wave is followed by the x descent as the atria undergo postsystolic relax- To avoid errors, it is best to measure Pra at the base of a wave just before
ation and the atrioventricular junction moves downward during early the onset of ventricular systole rather than as a mean value (Fig. 28-8). 27,28
ventricular systole. When visible, a c wave due to closure of the atrioven- Normal Pra is approximately 2 to 8 mm Hg. In the absence of left
29
tricular valves interrupts the x descent. When a c wave is seen, standard ventricular (LV) dysfunction, the Pra is typically 2 to 5 mm Hg lower
nomenclature dictates that the initial descent is termed x and the second than the Ppw. The Ppw may be markedly higher than the Pra in patients
30
descent is termed x’ (Fig. 28-7). After the x descent, the v (ventricular) who have either systolic or diastolic LV dysfunction. Conversely, the
31
wave is generated by passive filling of the atria during ventricular systole. Pra may exceed the Ppw in patients with RV failure due to increased
The y descent results from a fall in atrial pressure as the tricuspid valve pulmonary vascular resistance (PVR) or RV infarction (Fig. 28-9).
opens with the onset of diastole (Fig. 28-7).
use a dual channel recorder that allows simultaneous recording of cardiac ■ PULMONARY ARTERY PRESSURE
In order to evaluate pressure waveforms adequately, it is essential to
electrical activity and pressure. An electrocardiographic (ECG) lead that The pulmonary artery waveform has a systolic pressure wave and a dia-
clearly demonstrates atrial electrical activity should be chosen. Analysis stolic trough (Fig. 28-7). A dicrotic notch due to closure of the pulmonic
of the atrial pressure tracing begins with identification of the P wave in valve is occasionally seen on the terminal portion of the systolic pressure
the ECG. The first positive-pressure wave to follow the P wave is the wave. Like the right atrial v wave, the pulmonary artery systolic wave
a wave. The right atrial a wave usually is seen at the beginning of the QRS typically coincides with the T wave of the ECG (see Fig. 28-7). The pul-
complex, provided that atrioventricular conduction is normal (Fig. 28-7). monary artery diastolic pressure (Ppad) is recorded as the pressure just
When visible, the c wave follows the a wave by an interval equal to the before the beginning of the systolic pressure wave. Catheter whip arti-
electrocardiographic PR interval (Fig. 28-7). The peak of the right atrial facts can lead to significant underestimation of the Ppad (Fig. 28-10).
v wave normally occurs simultaneously with the T wave of the electrocar- The tip of the PAC is optimally positioned proximally in the main
diogram, provided that the QT interval is normal (Fig. 28-7). or lobar pulmonary arteries since distal placement may increase risk of
The Pra is often used as an estimate of RVEDP. Prominent a or v waves pulmonary artery rupture with balloon inflation. However, if the tip
32
will cause the mean Pra to overestimate RVEDP. A more frequent of the PAC is too proximal and lies just beyond the pulmonic valve, the
27
problem is underestimation of RVEDP when there is a large x or y catheter tip can fall back into the RV with small changes in patient posi-
descent. A large y descent often accompanies tricuspid regurgitation, and tion, or even with tidal ventilation (Fig. 28-11). This must be recognized
a prominent y descent (and often x descent) is also common with peri- and the catheter repositioned since a catheter tip in the RV may predis-
cardial constriction, right heart failure, and restrictive physiology caused pose to ventricular arrhythmias. Recognition that the tip has migrated
by diastolic dysfunction or marked hypervolemia (Figs. 28-8 and 28-9). back into the RV is facilitated by awareness of two principal differences
CO 2.2 L/min
60 Ppa 42/25 60 Ppw 8 60 Pra 23
30
30 30 a v
x
y
0 0 0
FIGURE 28-9. Acute pulmonary hypertension with right ventricular failure. Right atrial pressure (Pra) is much higher than pulmonary artery wedge pressure (Ppw). Note the prominent y
descent in the Pra tracing. Even though pulmonary vascular resistance is markedly elevated, there is only a moderate increase in pulmonary artery pressure (Ppa) because of decreased cardiac
output (CO). Scale in millimeters of mercury.
section02.indd 190 1/13/2015 2:05:31 PM