
Page 365 - Hall et al (2015) Principles of Critical Care-McGraw-Hill
P. 365
CHAPTER 31: The Pathophysiology of the Circulation in Critical Illness 235
■ EFFECTS OF PRESSURE OUTSIDE THE HEART ON CARDIAC OUTPUT intravenous infusion to increase vascular stressed volume. In contrast,
In the figures cited and the preceding discussions, values of Pms and Pra well-hydrated or overhydrated patients may tolerate even large amounts
of PEEP or increased mean intrathoracic pressure from elevated
were expressed relative to atmospheric pressure. However, the transmu-
ral pressure of the right atrium exceeds the Pra by the subatmospheric mechanical tidal volumes (V ) with no reduction in Q ˙ t because their
T
previously inactive vascular reflexes can increase Pms in well-filled
value (about −4 mm Hg) of the Ppl surrounding the heart. Consider
the effect of opening the thorax, which raises Ppl from −4 to 0 mm Hg: systemic vessels by the amount that Ppl increases with PEEP. These con-
siderations allow the physician to anticipate and treat the hypotension
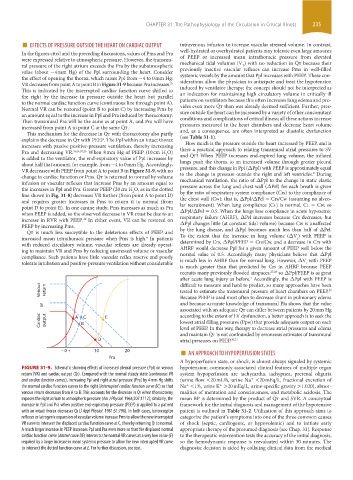
VR decreases from point A to point B in Figure 31-9 because Pra increases.
25
This is indicated by the interrupted cardiac function curve shifted to induced by ventilator therapy; the concept should not be interpreted as
an indication for maintaining high circulatory volume in critically ill
the right by the increase in pressure outside the heart but parallel
to the normal cardiac function curve (continuous line through point A). patients on ventilators because this often increases lung edema and pro-
vides even more Q ˙ t than was already deemed sufficient. Further, pres-
Normal VR can be restored (point B to point C) by increasing Pms by
an amount equal to the increase in Ppl and Pra induced by thoracotomy. sure outside the heart can be increased by a variety of other concomitant
conditions and complications of critical illness; all these actions increase
Then transmural Pra will be the same as at point A, and Pra will have
increased from point A to point C at the same Q ˙ t. pressures measured in the heart chambers and decrease heart volume
and, as a consequence, are often interpreted as diastolic dysfunction
This mechanism for the decrease in Q ˙ t with thoracotomy also partly
explains the decrease in Q ˙ t with PEEP. The Ppl within an intact thorax (see Table 31-1).
How much is the pressure outside the heart increased by PEEP, and is
increases with passive positive-pressure ventilation, thereby increasing
Pra and decreasing VR. 5,6,9,10,26 When 8 mm Hg of PEEP (10 cm H O) there a practical approach to relating transmural atrial pressures to SV
and Q ˙ t? When PEEP increases end-expired lung volume, the inflated
2
is added to the ventilator, the end-expiratory value of Ppl increases by
about half that amount, for example, from −4 to 0 mm Hg. Accordingly, lungs push the thorax to an increased volume through greater pleural
pressure, and this change in Ppl (ΔPpl) with PEEP is approximately equal
VR decreases with PEEP from point A to point B in Figure 31-9, with no 9
change in cardiac function or Pms. Q ˙ t is returned to normal by volume to the change in pressure outside the right and left ventricles. During
mechanical ventilation, the ratio of ΔPpl to the change in static elastic
infusion or vascular reflexes that increase Pms by an amount equal to
the increases in Ppl and Pra. Greater PEEP (20 cm H O, as in the dotted pressure across the lung and chest wall (ΔPel) for each breath is given
by the ratio of respiratory system compliance (Crs) to the compliance of
2
line shown in Fig. 31-8) decreases VR further (from point A to point D)
and requires greater increases in Pms to return it to normal (from the chest wall (Cw); that is, ΔPpl/ΔPel = Crs/Cw ( assuming no alveo-
lar recruitment). When lung compliance (Cl) is normal, Cl = Cw, so
point D to point E). In one canine study, Pms increases as much as Pra
when PEEP is added, so the observed decrease in VR must be due to an ΔPpl/ΔPel = 0.5. When the lungs lose compliance in acute hypoxemic
respiratory failure (AHRF), ΔPel increases because Crs decreases, but
increase in RVR with PEEP. In either event, VR can be restored on
20
PEEP by increasing Pms. ΔPpl changes little (at constant tidal volume) because Cw is unaffected
by the lung disease, and ΔPpl becomes much less than half of ΔPel.
Q ˙ t is much less susceptible to the deleterious effects of PEEP and
4
increased mean intrathoracic pressure when Pms is high. In patients To the extent that the increase in lung volume (ΔV ) with PEEP is
l
determined by Crs, ΔPpl/PEEP = Crs/Cw, and a decrease in Crs with
with reduced circulatory volume, vascular reflexes are already operat-
ing to maintain VR and Pms by reducing unstressed volume or vascular AHRF would decrease Ppl for a given amount of PEEP well below the
normal value of 0.5. Accordingly many physicians believe that ΔPpl
compliance. Such patients have little vascular reflex reserve and poorly
tolerate intubation and positive-pressure ventilation without considerable is much less in AHRF than for normal lung. However, ΔV with PEEP
l
is much greater than that predicted by Crs in AHRF because PEEP
recruits many previously flooded airspaces, 27,28 so ΔPpl/PEEP is as great
after acute lung injury as before. Accordingly, the ΔPpl with PEEP is
4
Venous return difficult to measure and hard to predict, so many approaches have been
tested to estimate the transmural pressure of heart chambers on PEEP.
29
Because PEEP is used most often to decrease shunt in pulmonary edema
and because accurate knowledge of transmural Pla shows that the value
or
associated with an adequate Q ˙ t can differ between patients by 20 mm Hg
Cardiac output A B C E according to the extent of LV dysfunction, a better approach is to seek the
lowest atrial filling pressures (Ppw) that provide adequate output on each
level of PEEP. In this way, therapy to decrease atrial pressures and edema
and maintain Q ˙ t is not confounded by erroneous estimates of transmural
D atrial pressures on PEEP. 30,31
– 0 + 10 20 ■ AN APPROACH TO HYPOPERFUSION STATES
Pra
A hypoperfusion state, or shock, is almost always signaled by systemic
FIGURE 31-9. Schematic showing effects of increased pleural pressure (Ppl) on venous hypotension; commonly associated clinical features of multiple organ
return (VR) and cardiac output (Qt). Compared with the normal steady state (continuous VR system hypoperfusion are tachycardia, tachypnea, prerenal oliguria
˙
and cardiac function curves), increasing Ppl and right atrial pressure (Pra) by 4 mm Hg shifts (urine flow <20 mL/h, urine Na <20 mEq/L, fractional excretion of
+
+
the normal cardiac function curves to the right (interrupted cardiac function curve BC) so that Na <1%, urine K >20 mEq/L, urine-specific gravity >1.020), abnor-
+
˙
venous return decreases from A to B. This accounts for the decrease in Qt when thoracotomy malities of mentation and consciousness, and metabolic acidosis. The
exposes the right atrium to atmospheric pressure (Am J Physiol. 1964;207:1112); similarly, the mean BP is determined by the product of Q ˙ t and SVR. A conceptual
increase in Ppl and Pra when positive end-expiratory pressure (PEEP) is applied to a patient framework for the initial diagnosis and management of the hypotensive
˙
with an intact thorax decreases Qt (J Appl Physiol. 1981;51:798). In both cases, baroreceptor patient is outlined in Table 31-2. Utilization of this approach aims to
reflexes or iatrogenic expansion of vascular volume increase Pms to allow the new interrupted categorize the patient’s symptoms into one of the three common causes
˙
VR curve to intersect the displaced cardiac function curve at C, thereby returning Qt to normal. of shock (septic, cardiogenic, or hypovolemic) and to initiate early
A much larger increase in PEEP increases Ppl and Pra even more so that the displaced normal appropriate therapy of the presumed diagnosis (see Chap. 33). Response
cardiac function curve (dotted curve DE) intersects the normal VR curves at a very low value (E) to the therapeutic intervention tests the accuracy of the initial diagnosis,
required by a larger increase in mean systemic pressure to allow the new interrupted VR curve so the hemodynamic response is reevaluated within 30 minutes. The
to intersect the dotted function curve at E. For further discussion, see text. diagnostic decision is aided by collating clinical data from the medical
section03.indd 235 1/23/2015 2:06:43 PM