
Page 40 - Hall et al (2015) Principles of Critical Care-McGraw-Hill
P. 40
CHAPTER 2: Measuring Quality 9
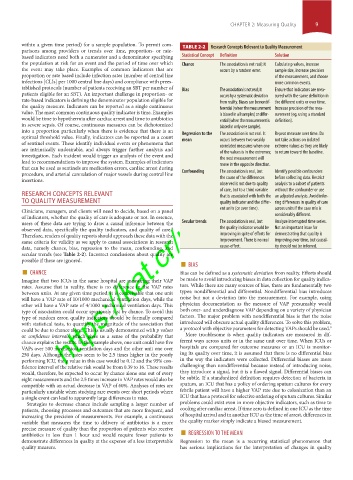
within a given time period) for a sample population. To permit com- TABLE 2-2 Research Concepts Relevant to Quality Measurement
parisons among providers or trends over time, proportion- or rate-
based indicators need both a numerator and a denominator specifying Statistical Concept Definition Solution
the population at risk for an event and the period of time over which Chance The association is not real; it Calculate p values, increase
the event may take place. Examples of common indicators that are occurs by a random error. sample size, increase precision
proportion or rate based include infection rates (number of central line of the measurement, and choose
infections [CLIs] per 1000 central line days) and compliance with prees- more common events.
tablished protocols (number of patients receiving an SBT per number of Bias The association is not real; it Ensure that indicators are mea-
patients eligible for an SBT). An important challenge in proportion- or occurs by a systematic deviation sured with the same definition in
rate-based indicators is defining the denominator population eligible for from reality. Biases can be nondif- the different units or over time.
the quality measure. Indicators can be reported as a single continuous ferential (when the measurement Increase precision of the mea-
https://kat.cr/user/tahir99/
value. The most common continuous quality indicator is time. Examples is biased in all samples) or differ- surement (eg, using a standard
would be time to hypothermia after cardiac arrest and time to antibiotics ential (when the measurement is definition).
in severe sepsis. Of course, continuous measures can be dichotomized biased in only one sample).
into a proportion particularly when there is evidence that there is an
optimal threshold value. Finally, indicators can be reported as a count Regression to the The association is not real. It Repeat measure over time. Do
not take actions on isolated
occurs between two weakly
mean
of sentinel events. These identify individual events or phenomena that
are intrinsically undesirable, and always trigger further analysis and correlated measures when one extreme values as they are likely
of the values is in the extremes; to return toward the baseline.
investigation. Each incident would trigger an analysis of the event and
lead to recommendations to improve the system. Examples of indicators the next measurement will
move in the opposite direction.
that can be used as sentinels are medication errors, cardiac arrest during
procedure, and arterial cannulation of major vessels during central line Confounding The association is real, but Identify possible confounders
insertions. the cause of the differences before collecting data. Restrict
observed is not due to quality analysis to a subset of patients
of care, but to a third variable without the confounder or use
RESEARCH CONCEPTS RELEVANT that is associated with both the an adjusted analysis. Avoid infer-
TO QUALITY MEASUREMENT quality indicator and the differ- ring differences in quality of care
Clinicians, managers, and clients will need to decide, based on a panel ent units (or over time). across units if the case mix is
of indicators, whether the quality of care is adequate or not. In essence, considerably different.
users of these data are trying to draw a causal inference between the Secular trends The association is real, but Analyze interrupted time series.
observed data, specifically the quality indicators, and quality of care. the quality indicator would be Not an important issue for
8
Therefore, readers of quality reports should approach these data with the improving in spite of efforts for demonstrating that quality is
same criteria for validity as we apply to causal associations in research improvement. There is no real improving over time, but causal-
data, namely chance, bias, regression to the mean, confounding, and cause-effect. ity should not be inferred.
secular trends (see Table 2-2). Incorrect conclusions about quality are
possible if these are ignored. ■ BIAS
■ CHANCE Bias can be defined as a systematic deviation from reality. Efforts should
Imagine that two ICUs in the same hospital are measuring their VAP be made to avoid introducing biases in data collection for quality indica-
rates. Assume that in reality, there is no difference in the VAP rates tors. While there are many sources of bias, there are fundamentally two
between units. At any given time period, it is conceivable that one unit types: nondifferential and differential. Nondifferential bias introduces
will have a VAP rate of 10/1000 mechanical ventilation days, while the noise but not a deviation into the measurement. For example, using
other will have a VAP rate of 4/1000 mechanical ventilation days. This physician documentation as the measure of VAP presumably would
type of association could occur spuriously just by chance. To avoid this both over- and underdiagnose VAP depending on a variety of physician
type of random error, quality indicators should be formally compared factors. The major problem with nondifferential bias is that the noise
with statistical tests, to quantify the magnitude of the association that introduced will obscure actual quality differences. To solve this problem,
could be due to chance alone. This is usually demonstrated with p values a protocol with objective parameters for detecting VAPs should be used. 9
or confidence intervals, which gives us a sense of the probability that More troublesome is when quality indicators are measured in dif-
chance explains the results. In the example above, one unit could have five ferent ways across units or in the same unit over time. When ICUs or
VAPs over 500 mechanical ventilation days and the other unit one over hospitals are compared for outcome measures or an ICU is monitor-
250 days. Although the rates seem to be 2.5 times higher in the poorly ing its quality over time, it is assumed that there is no differential bias
performing ICU, the p value in this case would be 0.12 and the 95% con- in the way the indicators were collected. Differential biases are more
fidence interval of the relative risk would be from 0.39 to 16. These results challenging than nondifferential because instead of introducing noise,
would, therefore, be expected to occur by chance alone one out of every they introduce a signal, but it is a flawed signal. Differential biases can
eight measurements and the 2.5 times increase in VAP rates would also be be subtle. If a standardized definition requires detection of bacteria in
compatible with an actual decrease in VAP of 60%. Analyses of rates are sputum, an ICU that has a policy of ordering sputum cultures for every
particularly unstable when studying rare events over short periods where febrile patient will have a higher VAP rate due to colonization than an
a single event can lead to apparently large differences in rates. ICU that has a protocol for selective ordering of sputum cultures. Similar
Strategies to decrease chance include sampling a larger number of problems could exist even in more objective indicators, such as time to
patients, choosing processes and outcomes that are more frequent, and cooling after cardiac arrest. If time zero is defined in one ICU as the time
increasing the precision of measurements. For example, a continuous of hospital arrival and in another ICU as the time of arrest, differences in
variable that measures the time to delivery of antibiotics is a more the quality marker simply indicate a biased measurement.
antibiotics in less than 1 hour and would require fewer patients to ■ REGRESSION TO THE MEAN
precise measure of quality than the proportion of patients who receive
demonstrate differences in quality at the expense of a less interpretable Regression to the mean is a recurring statistical phenomenon that
quality measure. has serious implications for the interpretation of changes in quality
Section01.indd 9 1/22/2015 9:36:43 AM