
Page 551 - Hall et al (2015) Principles of Critical Care-McGraw-Hill
P. 551
CHAPTER 43: The Pathophysiology and Differential Diagnosis of Acute Respiratory Failure 371
EF increases to 0.50. Because this value corresponds to 50% saturation aggravating the pulmonary edema. Some patients with chronic severe
– is 27 mm Hg. anemia (eg, chronic renal failure) become acutely ill with low cardiac
(10/20) of the normal hemoglobin concentration, Pv O 2
When cardiac output is returned toward normal with vasoactive drug or output and/or hypoxemic RF. Their tissue hypoxia is often ameliorated
– rises again. In another patient with normal cardiac by prompt, transient increases in their hemoglobin concentration with-
volume therapy, Pv O 2
= 40 mm Hg, O 2 out circulatory overload, as by plasmapheresis. Yet the institution of
output (5 L/min) but severe arterial hypoxemia (Pa O 2
– must decrease this therapy, like the others mentioned above, has complications that
saturation = 75%, Ca O 2 = 15 mL O 2/100 mL blood), Cv O 2
to 10 mL per 100 mL blood to provide the tissues with 250 mL/min must be weighed against the likely benefit in that patient at that time.
– decreases to 27 mm Hg. When cardiac output increases Accordingly, this approach to therapy of reduced blood O 2 transport
of O 2; again, Pv O 2
– increases again. In a third patient with implements early each of the three major interventions (Q ˙ t, hematocrit,
in response to hypoxia, Pv O 2
but with reduced concentration of hemoglobin ]) in a combination best suited to the
normal Q ˙ t and Pa O 2 and arterial oxygen saturation [Sa O 2
is reduced to 10 mL per 100 mL blood. condition of each patient. 1,11
(7.5 g/100 mL blood), Ca O 2
– – must decrease to 5 mL per 100 mL blood and Dissolved O 2 contributes a very small amount to Q ˙ . Yet, in critical
Accordingly, Cv O 2 and Pv O 2 O 2
27 mm Hg, respectively, to maintain aerobic metabolism, and these hypoxemia, raising the fraction of inspired oxygen (Fi O 2 ) to maximal val-
venous values increase again with greater cardiac output or hemoglobin ues may be effective. Consider again the patient with acute myocardial
11
concentration. In each case, V ˙ was maintained as Q ˙ decreased, creat- infarction without lung disease in whom low cardiac output has lowered
O 2
O 2
–
ing the horizontal continuous line in Figure 43-1 indicating that V ˙ is Pv O 2 to 27 mm Hg during air breathing. Even though the hemoglobin
O 2
independent of O 2 delivery in this range; V ˙ was constant because EF is fully saturated, Ca O 2 may be increased by 1.7 mL per 100 mL blood
O 2
–
increased in the hyperbolic manner indicated by the continuous line when Pa O 2 is increased to 650 mm Hg by ventilation with O 2. Then Cv O 2
relating EF to Q ˙ . increases from 10 to 11.7 mL O 2 per 100 mL blood, raising mixed venous
O 2
These considerations illustrate that one end point of reduced O – to about 34 mm Hg; of course, if anaerobic
– – 2 saturations to 58% and Pv O 2 – may not increase as
transport in the blood is reduced Pv O 2 . Since Pv O 2 approximates the P O 2 metabolism existed before oxygen therapy, Cv O 2
adjacent to the exchange vessels in the tissues, it is the driving pressure because V ˙ increases with oxygen. These changes tend
O 2
much as Ca O 2
– to diminish tissue hypoxia and the adverse consequences of anaero-
for O 2 diffusion from the capillaries to the metabolizing cells. When Pv O 2
falls too low, insufficient O 2 diffuses to maintain aerobic metabolism, bic metabolism by an amount equivalent to that achieved by a 1 g%
and the cells begin to produce lactic acid as the end point of anaero- increase in hemoglobin or a 0.2 L/min increase in cardiac output and
bic metabolism. This is illustrated in Figure 43-1 by the decrease in so complement a combined approach to hypoxia. Increasing Fi O 2 may
11
11
V ˙ as Q ˙ is reduced below 400 mL/min; this supply dependency of be affected by nasal prongs to deliver O 2 at 1 to 5 L/min (Fi O 2 0.21-0.4),
O 2
O 2
V ˙ occurs when EF exceeds 0.6 and tissue O 2 extraction can no lon- by rebreathing masks (Fi O 2 0.21-0.6), or by head tent (Fi O 2 0.21-0.8).
O 2
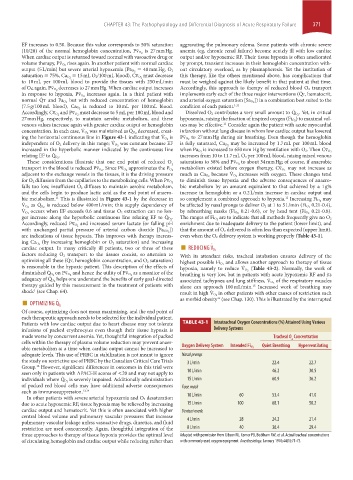
ger increase along the hyperbolic continuous line relating EF to Q ˙ . The ranges of Fi O 2 are to indicate that all methods frequently give no O 2
O 2
– and increased serum lactate (or falling pH enrichment due to inadequate delivery to the patient (lower limit), and
Accordingly, reduced Pv O 2
]) that the amount of O 2 delivered is often less than expected (upper limit),
with unchanged partial pressure of arterial carbon dioxide [Pa CO 2
are indications of tissue hypoxia. This improves with therapy increas- even when the O 2 delivery system is working properly (Table 43-1).
(by increasing hemoglobin or O 2 saturation) and increasing
ing Ca O 2 ■
cardiac output. In many critically ill patients, two or three of these REDUCING V ˙ O2
factors reducing O 2 transport to the tissues coexist, so attention to With its attendant risks, tracheal intubation ensures delivery of the
optimizing all these (Q ˙ t, hemoglobin concentration, and O 2 saturation) and allows another approach to therapy of tissue
is reasonable in the hypoxic patient. This description of the effects of highest possible Fi O 2
hypoxia, namely to reduce V ˙ (Table 43-2). Normally, the work of
– – as a monitor of the O 2
O 2
diminished Q ˙ on Pv O 2 and hence the utility of Pv O 2 breathing is very low, but in patients with acute hypoxemic RF and its
adequacy of Q ˙ helps one understand the benefits of early goal-directed associated tachypnea and lung stiffness, V ˙ of the respiratory muscles
O 2
O 2
therapy guided by this measurement in the treatment of patients with alone can approach 100 mL/min. Increased work of breathing may
15
shock (see Chap. 64). result in high V ˙ in other patients with other causes of restriction such
1
■ OPTIMIZING Q ˙ as morbid obesity (see Chap. 130). This is illustrated by the interrupted
O 2
16
O2
Of course, optimizing does not mean maximizing, and the end point of
each therapeutic approach needs to be selected for the individual patient.
Patients with low cardiac output due to heart disease may not tolerate TABLE 43-1 Intratracheal Oxygen Concentrations (%) Attained Using Various
infusions of packed erythrocytes even though their tissue hypoxia is Delivery Systems
made worse by concurrent anemia. Yet, thoughtful integration of packed Tracheal O Concentration
cells within the therapy of plasma volume reduction may prevent anaer- 2
obic metabolism at a time when cardiac output cannot be increased to Oxygen Delivery System Intended Fi O 2 Quiet Breathing Hyperventilating
adequate levels. This use of PRBC in stabilization is not meant to ignore Nasal prongs
the study on restrictive use of PRBC by the Canadian Critical Care Trials 3 L/min 22.4 22.7
Group. However, significant differences in outcomes in this trial were
12
seen only in patients with APACHE scores of <20 and may not apply to 10 L/min 46.2 30.5
individuals where Q ˙ is severely impaired. Additionally administration 15 L/min 60.9 36.2
O 2
of packed red blood cells may have additional adverse consequences Face mask
such as immunosuppression. 13,14
In other patients with severe arterial hypoxemia and O 2 desaturation 10 L/min 60 53.4 41.0
due to acute hypoxemic RF, tissue hypoxia may be relieved by increasing 15 L/min 100 68.1 50.2
cardiac output and hematocrit. Yet this is often associated with higher Venturi mask
central blood volume and pulmonary vascular pressures that increase
pulmonary vascular leakage unless vasoactive drugs, diuretics, and fluid 4 L/min 28 24.2 21.4
restriction are used concurrently. Again, thoughtful integration of the 8 L/min 40 36.4 29.4
three approaches to therapy of tissue hypoxia provides the optimal level Adapted with permission from Gibson RL, Comer PB, Beckham RW, et al. Actual tracheal concentrations
of circulating hemoglobin and cardiac output while reducing rather than with commonly used oxygen equipment. Anesthesiology. January 1976;44(1):71-73.
section04.indd 371 1/23/2015 2:18:41 PM