
Page 43 - Cardiac Nursing
P. 43
92806_c01.qxd 11/21/11 10:30 AM Page 19
CHAPTER 1 / Cardiac Anatomy and Physiology 19
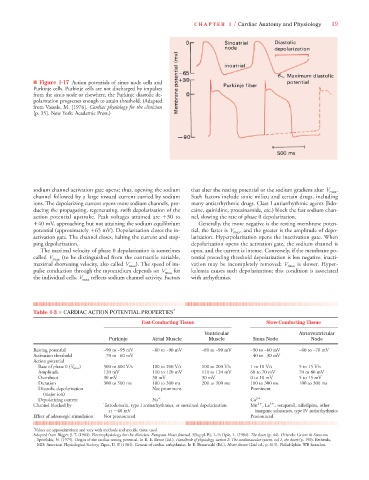
■ Figure 1-17 Action potentials of sinus node cells and
Purkinje cells. Purkinje cells are not discharged by impulses
from the sinus node or elsewhere, the Purkinje diastolic de-
polarization progresses enough to attain threshold. (Adapted
from Vassale, M. [1976]. Cardiac physiology for the clinician
[p. 35]. New York: Academic Press.)
sodium channel activation gate opens; thus, opening the sodium that alter the resting potential or the sodium gradient alter V max .
channel followed by a large inward current carried by sodium Such factors include ionic milieu and certain drugs, including
ions. The depolarizing current opens more sodium channels, pro- many antiarrhythmic drugs. Class I antiarrhythmic agents (lido-
ducing the propagating, regenerating, swift depolarization of the caine, quinidine, procainamide, etc.) block the fast sodium chan-
action potential upstroke. Peak voltages attained are 30 to nel, slowing the rate of phase 0 depolarization.
40 mV, approaching but not attaining the sodium equilibrium Generally, the more negative is the resting membrane poten-
potential (approximately 65 mV). Depolarization closes the in- tial, the faster is V max , and the greater is the amplitude of depo-
activation gate. The channel closes, halting the current and stop- larization. Hyperpolarization opens the inactivation gate. When
ping depolarization. depolarization opens the activation gate, the sodium channel is
The maximal velocity of phase 0 depolarization is sometimes open, and the current is intense. Conversely, if the membrane po-
called V max (to be distinguished from the contractile variable, tential preceding threshold depolarization is less negative, inacti-
maximal shortening velocity, also called V max ). The speed of im- vation may be incompletely removed; V max is slower. Hyper-
pulse conduction through the myocardium depends on V max for kalemia causes such depolarization; this condition is associated
the individual cells. V max reflects sodium channel activity. Factors with arrhythmias.
Table 1-3 ■ CARDIAC ACTION POTENTIAL PROPERTIES *
Fast-Conducting Tissue Slow-Conducting Tissue
Ventricular Atrioventricular
Purkinje Atrial Muscle Muscle Sinus Node Node
Resting potential –90 to –95 mV –80 to –90 mV –80 to –90 mV –50 to –60 mV –60 to –70 mV
Activation threshold –70 to –60 mV –40 to –30 mV
Action potential
Rate of phase 0 (V max ) 500 to 800 V/s 100 to 200 V/s 100 to 200 V/s 1 to 10 V/s 5 to 15 V/s
Amplitude 120 mV 110 to 120 mV 110 to 120 mV 60 to 70 mV 70 to 80 mV
Overshoot 30 mV 30 mV 30 mV 0 to 10 mV 5 to 15 mV
Duration 300 to 500 ms 100 to 300 ms 200 to 300 ms 100 to 300 ms 100 to 300 ms
Diastolic depolarization Not prominent Prominent
(major ion)
Depolarizing current Na Ca 2
2
3
Channel blocked by Tetrodotoxin, type I antiarrhythmics, or sustained depolarization Mn , La , verapamil, nifedipine, other
at 40 mV inorganic substances, type IV antiarrhythmics
Effect of adrenergic stimulation Not pronounced Pronounced
* Values are approximations and vary with methods and specific tissue used.
Adapted from Bigger, J. T. (1984). Electrophysiology for the clinician. European Heart Journal, 5(Suppl. B), 1–9; Opie, L. (1984). The heart (p. 44). Orlando: Grune & Stratton;
Sperelakis, N. (1979). Origin of the cardiac resting potential. In R. E. Berne (Ed.), Handbook of physiology, section 2: The cardiovascular system, vol 1, the heart (p. 190). Bethesda,
MD: American Physiological Society; Zipes, D. P. (1984). Genesis of cardiac arrhythmias. In E. Braunwald (Ed.), Heart disease (2nd ed., p. 615). Philadelphia: WB Saunders.