
Page 511 - Cardiac Nursing
P. 511
9/0
0
9/2
8:2
009
0-5
p46
10.
qxd
10.
87
e 4
87
ara
Apt
M
8 A
P
g
P
21_
0-c
LWB K34 0-c 21_ p46 0-5 10. qxd 0 9/0 9/2 009 0 0 8:2 8 A M P a a g e 4 87 Apt ara
L L LWB
K34
K34
LWBK340-c21_21_p460-510.qxd 09/09/2009 08:28 AM Page 487 Aptara
C HAPTER 2 1 / Hemodynamic Monitoring 487
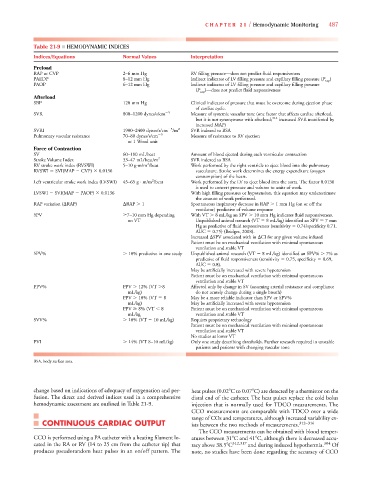
Table 21-9 ■ HEMODYNAMIC INDICES
Indices/Equations Normal Values Interpretation
Preload
RAP or CVP 2–6 mm Hg RV filling pressure—does not predict fluid responsiveness
PAEDP 8–12 mm Hg Indirect indicator of LV filling pressure and capillary filling pressure (P cap )
P P
PAOP 6–12 mm Hg Indirect indicator of LV filling pressure and capillary filling pressure
(P cap )—does not predict fluid responsiveness
P P
Afterload
SBP 120 mm Hg Clinical indicator of pressure that must be overcome during ejection phase
of cardiac cycle.
SVR 800–1200 dynes/s/cm 5 Measure of systemic vascular tone (one factor that affects cardiac afterload,
but it is not synonymous with afterload; 311 increased SVR manifested by
increased MAP)
SVRI 1900–2400 dynes/s/cm 5 /m 2 SVR indexed to BSA
Pulmonary vascular resistance 70–80 dynes/s/cm 5 Measure of resistance to RV ejection
or 1 Wood unit
Force of Contraction
SV 60–180 mL/beat Amount of blood ejected during each ventricular contraction
Stroke Volume Index 33–47 mL/beat/m 2 SVR indexed to BSA
2
RV stroke work index (RVSWI) 5–10 g-m/m /beat Work performed by the right ventricle to eject blood into the pulmonary
RVSWI SVI(MAP CVP) 0.0136 vasculature. Stroke work determines the energy expenditure (oxygen
consumption) of the heart.
2
Left ventricular stroke work index (LVSWI) 45–65 g ⋅ m/m /beat Work performed by the LV to eject blood into the aorta. The factor 0.0136
is used to convert pressure and volume to units of work.
LVSWI SVI(MAP PAOP) 0.0136 With high filling pressures or hypotension, this equation may underestimate
the amount of work performed.
RAP variation ( RAP) RAP 1 Spontaneous inspiratory decrease in RAP 1 mm Hg (on or off the
ventilator) predictive of volume response
SPV 7–10 mm Hg depending With VT 8 mL/kg an SPV 10 mm Hg indicates fluid responsiveness.
on VT Unpublished animal research (VT 8 mL/kg) identified an SPV 7 mm
Hg as predictive of fluid responsiveness (sensitivity 0.74/specificity 0.71,
AUC 0.75) (Bridges, 2008).
Increased SPV associated with in CI for any given volume infused
Patient must be on mechanical ventilation with minimal spontaneous
ventilation and stable VT
SPV% 10% predictive in one study Unpublished animal research (VT 8 mL/kg) identified an SPV% 7% as
predictive of fluid responsiveness (sensitivity 0.75, specificity 0.69,
AUC 0.8).
May be artificially increased with severe hypotension
Patient must be on mechanical ventilation with minimal spontaneous
ventilation and stable VT
PPV% PPV 12% (VT 8 Affected only by change in SV (assuming arterial resistance and compliance
mL/kg) do not acutely change during a single breath)
PPV 10% (VT 8 May be a more reliable indicator than SPV or SPV%
mL/kg) May be artificially increased with severe hypotension
PPV 8% (VT 8 Patient must be on mechanical ventilation with minimal spontaneous
mL/kg ventilation and stable VT
SVV% 10% (VT 10 mL/kg) Requires proprietary technology
Patient must be on mechanical ventilation with minimal spontaneous
ventilation and stable VT
No studies at lower VT
PVI 14% (VT 8–10 mL/kg) Only one study describing thresholds. Further research required in unstable
patients and patients with changing vascular tone
BSA, body surface area.
change based on indications of adequacy of oxygenation and per- heat pulses (0.02 C to 0.07 C) are detected by a thermistor on the
fusion. The direct and derived indices used in a comprehensive distal end of the catheter. The heat pulses replace the cold bolus
hemodynamic assessment are outlined in Table 21-9. injection that is normally used for TDCO measurements. The
CCO measurements are comparable with TDCO over a wide
range of COs and temperatures, although increased variability ex-
CONTINUOUS CARDIAC OUTPUT ists between the two methods of measurements. 312–316
The CCO measurements can be obtained with blood temper-
CCO is performed using a PA catheter with a heating filament lo- atures between 31 C and 41 C, although there is decreased accu-
cated in the RA or RV (14 to 25 cm from the catheter tip) that racy above 38.5 C 312,317 and during induced hypothermia. 304 Of
produces pseudorandom heat pulses in an on/off pattern. The note, no studies have been done regarding the accuracy of CCO