
Page 506 - Cardiac Nursing
P. 506
p46
g
P
0-5
P
Apt
ara
82
e 4
82
9/0
0
8:2
009
9/2
8 A
M
10.
qxd
10.
LWBK340-c21_21_p460-510.qxd 09/09/2009 08:28 AM Page 482 Aptara
LWB
L L LWB K34 0-c 21_ p46 0-5 10. qxd 0 9/0 9/2 009 0 0 8:2 8 A M P a a g e 4 82 Apt ara
K34
0-c
21_
K34
482 P A R T III / Assessment of Heart Disease
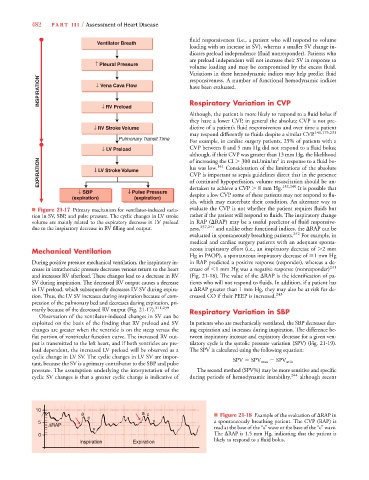
fluid responsiveness (i.e., a patient who will respond to volume
Ventilator Breath
loading with an increase in SV), whereas a smaller SV change in-
dicates preload independence (fluid nonresponder). Patients who
are preload independent will not increase their SV in response to
↑ Pleural Pressure
volume loading and may be compromised by the excess fluid.
Variations in these hemodynamic indices may help predict fluid
INSPIRATION` ↓ Vena Cava Flow have been evaluated.
responsiveness. A number of functional hemodynamic indices
Respiratory Variation in CVP
↓ RV Preload
Although, the patient is more likely to respond to a fluid bolus if
they have a lower CVP, in general the absolute CVP is not pre-
↓ RV Stroke Volume dictive of a patient’s fluid responsiveness and over time a patient
may respond differently to fluids despite a similar CVP. 141,175,231
Pulmonary Transit Time
For example, in cardiac surgery patients, 25% of patients with a
↓ LV Preload CVP between 0 and 5 mm Hg did not respond to a fluid bolus;
although, if their CVP was greater than 13 mm Hg, the likelihood
2
EXPIRATION ↓ LV Stroke Volume lus was low. 141 Consideration of the limitations of the absolute
of increasing the CI 300 mL/min/m in response to a fluid bo-
CVP is important as sepsis guidelines direct that in the presence
of continued hypoperfusion, volume resuscitation should be un-
↓ SBP ↓ Pulse Pressure dertaken to achieve a CVP 8 mm Hg. 132,240 It is possible that
(expiration) (expiration) despite a low CVP some of these patients may not respond to flu-
ids, which may exacerbate their condition. An alternate way to
■ Figure 21-17 Primary mechanism for ventilator-induced varia- evaluate the CVP is not whether the patient requires fluids but
tion in SV, SBP, and pulse pressure. The cyclic changes in LV stroke rather if the patient will respond to fluids. The inspiratory change
volume are mainly related to the expiratory decrease in LV preload in RAP ( RAP) may be a useful predictor of fluid responsive-
due to the inspiratory decrease in RV filling and output. ness, 237,241 and unlike other functional indices, the RAP can be
evaluated in spontaneously breathing patients. 242 For example, in
medical and cardiac surgery patients with an adequate sponta-
Mechanical Ventilation neous inspiratory effort (i.e., an inspiratory decrease of 2 mm
Hg in PAOP), a spontaneous inspiratory decrease of 1 mm Hg
During positive pressure mechanical ventilation, the inspiratory in- in RAP predicted a positive response (responder), whereas a de-
crease in intrathoracic pressure decreases venous return to the heart crease of 1 mm Hg was a negative response (nonresponder) 241
and increases RV afterload. These changes lead to a decrease in RV (Fig. 21-18). The value of the RAP is the identification of pa-
SV during inspiration. The decreased RV output causes a decrease tients who will not respond to fluids. In addition, if a patient has
in LV preload, which subsequently decreases LV SV during expira- a RAP greater than 1 mm Hg, they may also be at risk for de-
tion. Thus, the LV SV increases during inspiration because of com- creased CO if their PEEP is increased. 243
pression of the pulmonary bed and decreases during expiration, pri-
marily because of the decreased RV output (Fig. 21-17). 211,239 Respiratory Variation in SBP
Observation of the ventilator-induced changes in SV can be
exploited on the basis of the finding that RV preload and SV In patients who are mechanically ventilated, the SBP decreases dur-
changes are greater when the ventricle is on the steep versus the ing expiration and increases during inspiration. The difference be-
flat portion of ventricular function curve. The increased RV out- tween inspiratory increase and expiratory decrease for a given ven-
put is transmitted to the left heart, and if both ventricles are pre- tilatory cycle is the systolic pressure variation (SPV) (Fig. 21-19).
load dependent, the increased LV preload will be observed as a The SPV is calculated using the following equation:
cyclic change in LV SV. The cyclic changes in LV SV are impor- V V
tant, because the SV is a primary contributor to the SBP and pulse SPV SPV max SPV min
pressure. The assumption underlying the interpretation of the The second method (SPV%) may be more sensitive and specific
cyclic SV changes is that a greater cyclic change is indicative of during periods of hemodynamic instability, 244 although recent
10
a a a c ■ Figure 21-18 Example of the evaluation of RAP in
c
5 v v v a spontaneously breathing patient. The CVP (RAP) is
R
RAP
Δ ΔRAP
v read at the base of the “a” wave or the base of the “c” wave.
0 The RAP is 1.5 mm Hg, indicating that the patient is
likely to respond to a fluid bolus.
a
s
Inspirationation Expirationation