
Page 56 - Cardiac Nursing
P. 56
92806_c01.qxd 11/21/11 10:30 AM Page 32
32 PA R T I / Anatomy and Physiology
contraction). Left ventricular afterload is determined by the vol- cardiac transplant patient, providing a mechanism to increase car-
ume and mass of blood ejected by the ventricle, the resistance to diac output, particularly early in exercise.
blood flow (determined mainly by the cross-sectional area of the Some treatment approaches take advantage of the length–
small arterioles, known as resistance vessels), aortic impedance tension characteristics of the heart. Examples of this are leg rais-
(amount of pressure change for a given volume of blood ejected ing and intravascular volume expansion in the patient with shock.
into the aorta; this depends on the elasticity of the aorta and These therapies increase central blood volume and improve car-
branching arteries), and intrathoracic pressures. The arterial sys- diac contractile force; they are easily and rapidly accessible. They
tolic pressure is a useful clinical indicator of the left ventricular are, however, associated with an increase in myocardial oxygen
afterload; pulmonary systolic pressure suggests right ventricular consumption and should be used carefully in the patient at risk
afterload. Total systemic vascular resistance and total pulmonary for myocardial ischemia. These patients should be monitored for
vascular resistance are also used to suggest left and right ventricu- ECG signs of myocardial ischemia and for symptoms such as
lar afterload, respectively. chest pain when interventions increase the preload.
It is often clinically useful to monitor an indicator of cardiac vol-
Preload Role: Length–Tension Relationship ume (such as jugular venous distension, pulmonary artery or cen-
Early in the twentieth century, Starling observed that within lim- tral venous pressures, location of the point of maximum impulse)
its, an increase in left ventricular volume at the end of diastole re- and a concurrently measured indicator of the tension generated
sulted in the generation of increased active pressure and increased (such as cardiac output). The length–tension relationship charac-
volume pumped during the ensuing contraction. Beyond a cer- terizes the mechanical functioning of the heart and can be helpful
tain volume, this mechanism is no longer operational; increased in judging the efficacy of therapies (see Fig. 1-32). Positive inotropic
end-diastolic volume results instead in decreased pressure devel- factors, that is, factors that increase the contractility of the heart,
oping and a decreased volume of blood being ejected. 56 This such as sympathetic stimulation, alter the length–tension relation,
property is known as Starling’s law of the heart or the length– so that a higher tension is generated at the same left ventricular end-
tension relation of cardiac muscle (or sometimes, the Frank- diastolic volume. In the failing heart, the same stretch generates
Starling law of the heart). This property is commonly illustrated much less tension and cardiac output does not substantially increase
in a graph (Fig. 1-32). Although the left ventricular volume at the with volume. The heart is said to be refractory to inotropic stimu-
end of diastole is a factor that determines the subsequent force of lation; it could be said that the Starling curve is reduced.
contraction, clinicians measure pressure increments, not volume. The cross-bridge theory of muscle contraction partly accounts
However, the volume and the pressure are related, as discussed for the cardiac muscle length–tension relationship. Tension gener-
later (see “Compliance” section). ated by muscle is proportional to the number of crossbridges
The length–tension mechanism is useful; it likely contributes formed. At short lengths, thin filaments overlap one another and
to overall matching of the left and right ventricular outputs. For interfere with cross-bridge formation. Maximal tension develop-
instance, if a person reclines after being in a standing position (or ment occurs in the range of muscle lengths at which the myosin
elevates the legs when in a reclining position), the volume of crossbridge regions maximally overlap the thin filaments without
blood returning to the heart transiently increases. The right ven- the thin filaments overlapping one another. If the muscle is
tricle is stretched and increases its force of contraction, pumping stretched still further, then the region of cross-bridge overlap is di-
a larger stroke volume into the pulmonary circulation. Pulmonary minished and less tension is developed. 57
vascular pressures increase. This increased right ventricular output Other factors also contribute to the shape of the Starling curve.
increases left ventricular filling volume and preload. The left ven- For example, when the heart is stretched, more cells may be
tricle pumps a larger stroke volume and arterial vascular pressures brought into parallel with the axis of shortening and may be able
increase. This intrinsic ability of the heart to match increased car- to contribute more effectively to the total development of force
diac return with increased volume pumped is useful in case of the within the ventricle. Calcium ion, which grades the force of con-
traction, may enter the sarcoplasm in larger quantities for longer
periods of time. Contractile filaments may be more sensitive to
calcium ion at longer sarcomere lengths.
Compliance. Starling’s law of the heart relates end-diastolic
length, rather than end-diastolic pressure, to the strength of con-
traction. However, end-diastolic length and pressure are related.
Compliance is the term used to describe that relation. Compliance
(C) is the change in volume ( V) that results for a given change
in pressure ( P):
¢V
C
¢P
Stiffness (S) is the inverse of compliance (S P/ V). Increased
stiffness is the same as decreased compliance.
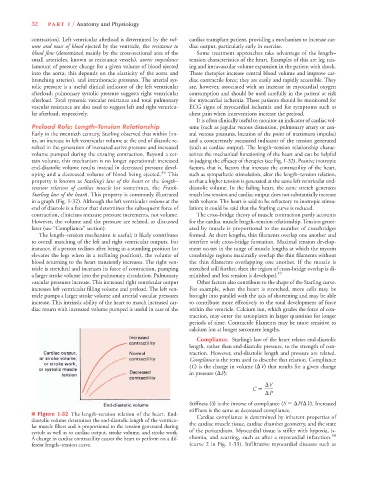
■ Figure 1-32 The length–tension relation of the heart. End- Cardiac compliance is determined by inherent properties of
diastolic volume determines the end-diastolic length of the ventricu-
lar muscle fibers and is proportional to the tension generated during the cardiac muscle tissue, cardiac chamber geometry, and the state
systole as well as to cardiac output, stroke volume, and stroke work. of the pericardium. Myocardial tissue is stiffer with hypoxia, is-
58
A change in cardiac contractility causes the heart to perform on a dif- chemia, and scarring, such as after a myocardial infarction.
ferent length–tension curve. (curve 2 in Fig. 1-33). Infiltrative myocardial diseases such as