
Page 785 - Cardiac Nursing
P. 785
6
6
/
0
/
/
0
/
009
1
1
009
2
2
009
0
3-7
68.
68.
3-7
p7
p7
5
qx
3
0
0
3
qx
d
d
g
e 7
e 7
g
M
Pa
Pa
61
ara
ara
ara
Apt
61
61
Apt
M
4 A
A
A
4 A
1
2:0
2:0
A
A
A
A
A
A
A
A
K34
K34
LWB
L L LWB
LWBK340-c32_32_p7553-768.qxd 30/06/2009 12:04 AM Page 761 Aptara
0-c
32_
32_
0-c
C HAPTER 32 / Coronary Heart Disease Risk Factors 761
Prevention Programme demonstrated a 28.5% risk reduction for Age
diabetes with lifestyle intervention in a high-risk Asian Indian 18-24 25-34 35-44 45-54 55-64 65+
93
population. The DPP lifestyle intervention was also found to be
94
effective in reducing risk factors for CVD as well as components 70
of the metabolic syndrome. 95 These results provide some of the 60
most dramatic and powerful endorsements to date for primary 50
prevention of diabetes through intensive behavioral intervention 40
(see Chapter 39 for further discussion of diabetes). Percent 30
20
10
BODY WEIGHT
0
<24.9 25.29.9 30+
The proportion of U.S. adults characterized as overweight and A BMI (kg/m )
2
obese is reaching epidemic proportions. Widely, NIH Clinical
Guidelines suggest that overweight and obesity be defined as a Race/Ethnicity
2
2
body mass index of 25.0 to 29.9 kg/m and 30 or greater kg/m , Caucasian African-American Hispanic
respectively. 96 For example, an individual who is 5 ft 8 in tall Other Multiracial
would be overweight at 165 lb and obese at 200 lb. Using these 60
definitions, the NHANES data surveys show that compared to
data collected from 1976 to 1980, from 1999 to 2000 the age-ad- 50
justed prevalence of overweight and obesity in adults (BMI 25 40
97
2
kg/m ) increased from 47% to 64.5%. Further NHANES data Percent
from 2003 to 2004 indicate an increase to 66.3%. Prevalence of 30
2
obesity (BMI 30 kg/m ) and extreme obesity (BMI 40 20
2
kg/m ) increased during these time periods as well. Data from the
2001 Behavioral Risk Factor Survey show that overweight and 10
obesity increase with age, peaking at mid-life, and that the preva- 0
lence of obesity is highest in African-American and multiracial in- <24.9 25.29.9 30+
dividuals, and lowest in Caucasians and those classified as “other” B BMI (kg/m )
2
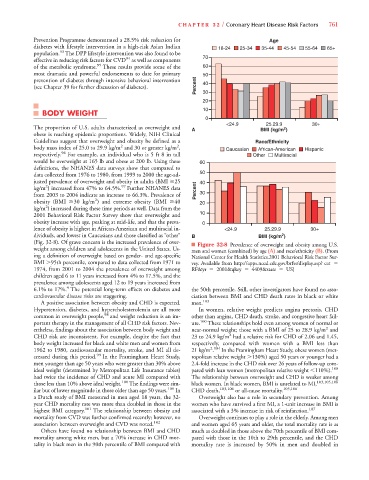
(Fig. 32-8). Of grave concern is the increased prevalence of over- ■ Figure 32-8 Prevalence of overweight and obesity among U.S.
weight among children and adolescents in the United States. Us- men and women (combined) by age (A) and race/ethnicity (B). (From
ing a definition of overweight based on gender- and age-specific National Center for Health Statistics.2001 Behavioral Risk Factor Sur-
BMI 95th percentile, compared to data collected from 1971 to vey. Available from http://apps.nccd.cdc.gov/brfss/display.asp? cat
1974, from 2001 to 2004 the prevalence of overweight among RF&yr 2001&qkey 4409&state US)
children aged 6 to 11 years increased from 4% to 17.5%, and the
prevalence among adolescents aged 12 to 19 years increased from
4
6.1% to 17%. The potential long-term effects on diabetes and the 50th percentile. Still, other investigators have found no asso-
cardiovascular disease risks are staggering. ciation between BMI and CHD death rates in black or white
A positive association between obesity and CHD is expected. men. 103
Hypertension, diabetes, and hypercholesterolemia are all more In women, relative weight predicts angina pectoris, CHD
98
common in overweight people, and weight reduction is an im- other than angina, CHD death, stroke, and congestive heart fail-
portant therapy in the management of all CHD risk factors. Nev- ure. 100 These relationships hold even among women of normal or
2
ertheless, findings about the association between body weight and near-normal weight; those with a BMI of 25 to 28.9 kg/m and
2
CHD risk are inconsistent. For example, despite the fact that 23 to 24.9 kg/m had a relative risk for CHD of 2.06 and 1.45,
body weight increased for black and white men and women from respectively, compared with women with a BMI less than
2 104
1962 to 1980, cardiovascular mortality, stroke, and MI all de- 21 kg/m . In the Framingham Heart Study, obese women (met-
creased during this period. 99 In the Framingham Heart Study, ropolitan relative weight 130%) aged 50 years or younger had a
men younger than age 50 years who were greater than 30% above 2.4-fold increase in the CHD risk over 26 years of follow-up com-
ideal weight (determined by Metropolitan Life Insurance tables) pared with lean women (metropolitan relative weight 110%). 100
had twice the incidence of CHD and acute MI compared with The relationship between overweight and CHD is weaker among
those less than 10% above ideal weight. 100 The findings were sim- black women. In black women, BMI is unrelated to MI, 103,105,106
ilar but of lower magnitude in those older than age 50 years. 100 In CHD death, 103,106 or all-cause mortality. 105,106
a Dutch study of BMI measured in men aged 18 years, the 32- Overweight also has a role in secondary prevention. Among
year CHD mortality rate was more than doubled in those in the women who have survived a first MI, a 1-unit increase in BMI is
highest BMI category. 101 The relationship between obesity and associated with a 3% increase in risk of reinfarction. 107
mortality from CVD was further confirmed recently; however, no Overweight continues to play a role in the elderly. Among men
association between overweight and CVD was noted. 102 and women aged 65 years and older, the total mortality rate is as
Others have found no relationship between BMI and CHD much as doubled in those above the 70th percentile of BMI com-
mortality among white men, but a 70% increase in CHD mor- pared with those in the 10th to 29th percentile, and the CHD
tality in black men in the 90th percentile of BMI compared with mortality rate is increased by 50% in men and doubled in