
Page 867 - Cardiac Nursing
P. 867
LWBK340-c37_p842-860.qxd 29/06/2009 09:40 PM Page 843 Aptara
C HAP TE R 37 / Exercise and Activity 843
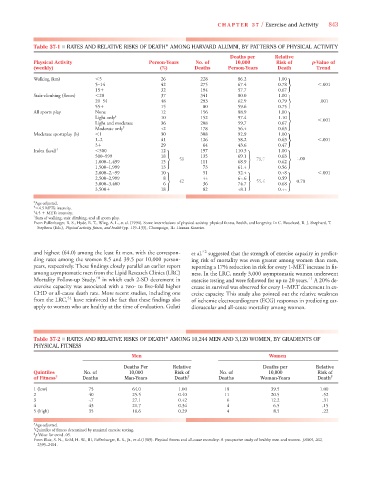
Table 37-1 ■ RATES AND RELATIVE RISKS OF DEATH* AMONG HARVARD ALUMNI, BY PATTERNS OF PHYSICAL ACTIVITY
Deaths per Relative
Physical Activity Person-Years No. of 10,000 Risk of p-Value of
(weekly) (%) Deaths Person-Years Death Trend
Walking (km) 5 26 228 86.2 1.00
5–14 42 275 67.4 0.78 r .001
15
32 194 57.7 0.67
Stair-climbing (floors) 20 37 341 80.0 1.00
20–54 48 293 62.9 0.79 r .001
55
15 80 59.6 0.75
All sports play None 12 156 88.9 1.00
Light only † 10 152 97.4 1.10 .001
Light and moderate 36 208 59.7 0.67 s
Moderate only ‡ 42 178 56.4 0.63
Moderate sportsplay (h) 1 30 308 92.9 1.00
1–2 41 126 58.2 0.63 r .001
3
29 64 43.6 0.47
Index (kcal) § 500 12 197 110.3 1.00
500–999 18 135 69.1 0.63 1.00
1,000–1,499 15 s 58 111 68.9 s 78.9 0.62 s
1,500–1,999 13 73 61.4 0.56
2,000–2,499 10 51 52.4 0.48 .001
2,500–2,999 8 44 64.6 0.59
3,000–3,400 6 s 42 36 74.7 s 55.4 0.68 s 0.70
3,500
18 82 48.1 0.44
*Age-adjusted.
† 4.5 METs intensity.
‡ 4.5
METs intensity.
§ Sum of walking, stair climbing, and all sports play.
From Paffenbarger, R. S., Hyde, R. T., Wing, A. L., et al. (1994). Some interrelations of physical activity, physical fitness, health, and longevity. In C. Bouchard, R. J. Shephard, T.
Stephens (Eds.), Physical activity, fitness, and health (pp. 119–133), Champaign, IL: Human Kinetics.
and highest (64.0) among the least fit men, with the correspon- et al. 52 suggested that the strength of exercise capacity in predict-
ding rates among the women 8.5 and 39.5 per 10,000 person- ing risk of mortality was even greater among women than men,
years, respectively. These findings closely parallel an earlier report reporting a 17% reduction in risk for every 1-MET increase in fit-
among asymptomatic men from the Lipid Research Clinics (LRC) ness. In the LRC, nearly 3,000 asymptomatic women underwent
Mortality Follow-up Study, 50 in which each 2-SD decrement in exercise testing and were followed for up to 20 years. A 20% de-
51
exercise capacity was associated with a two- to five-fold higher crease in survival was observed for every 1–MET decrement in ex-
CHD or all-cause death rate. More recent studies, including one ercise capacity. This study also pointed out the relative weakness
from the LRC, 51 have reinforced the fact that these findings also of ischemic electrocardiogram (ECG) responses in predicting car-
apply to women who are healthy at the time of evaluation. Gulati diovascular and all-cause mortality among women.
Table 37-2 ■ RATES AND RELATIVE RISKS OF DEATH* AMONG 10,244 MEN AND 3,120 WOMEN, BY GRADIENTS OF
PHYSICAL FITNESS
Men Women
Deaths Per Relative Deaths per Relative
Quintiles No. of 10,000 Risk of No. of 10,000 Risk of
of Fitness † Deaths Man-Years Death ‡ Deaths Woman-Years Death ‡
1 (low) 75 64.0 1.00 18 39.5 1.00
2 40 25.5 0.40 11 20.5 .52
3 47 27.1 0.42 6 12.2 .31
4 43 21.7 0.34 4 6.5 .15
5 (high) 35 18.6 0.29 4 8.5 .22
*Age-adjusted.
†
Quintiles of fitness determined by maximal exercise testing.
‡ ‡
p Value for trend .05.
2
2
From Blair, S. N., Kohl, H. W., III, Paffenbarger, R. S., Jr., et al.(1989). Physical fitness and all-cause mortality: A prospective study of healthy men and women. JAMA, 262,
2395–2401.