
Page 868 - Cardiac Nursing
P. 868
0
0
6
9
/
/
2
2
009
6
/
/
60.
qx
qx
2-8
2-8
60.
2
9
9
d
d
2
009
44
44
Apt
g
e 8
e 8
ar
a
a
Apt
Apt
ar
9:4
9:4
0 P
009
0
0
Pa
Pa
g
0 P
M
M
LWB
L L LWB
K34
p84
K34
p84
0-c
37_
LWBK340-c37_37_p84p842-860.qxd 29/06/2009 09:40 PM Page 844 Aptara
37_
0-c
844 PA R T V / Health Promotion and Disease Prevention
5
(2.95-6.83)
4.5
(3.29-5.16)
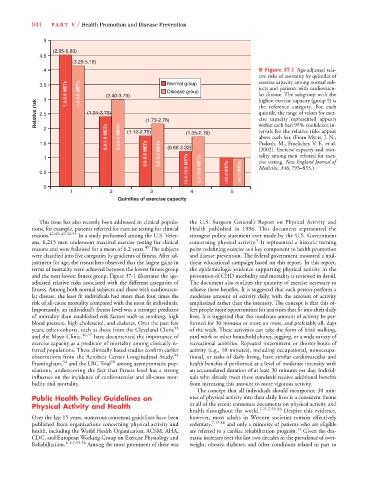
4 ■ Figure 37-1 Age-adjusted rela-
tive risks of mortality by quintiles of
3.5 1.0-5.9 METs 1.0-4.9 METs (2.40-3.73) Normal group exercise capacity among normal sub-
jects and patients with cardiovascu-
Disease group
lar disease. The subgroup with the
3
Relative risk 2.5 (1.54 3.75) (1.73-2.76) highest exercise capacity (group 5) is
the reference category. For each
quintile, the range of values for exer-
(1.54-3.75)
cise capacity represented appears
6.0-7.9 METs 5.0-6.4 METs above each bar. (From Myers, J. N.,
2 (1.12-2.75) (1.35-2.19) within each bar; 95% confidence in-
tervals for the relative risks appear
1.5 (0.68-2.22) Prakash, M., Froelicher, V. F., et al.
[2002]. Exercise capacity and mor-
1 8.0-9.9 METs 6.5-8.2 METs tality among men referred for exer-
cise testing. New England Journal of
6
6
0.5 10.0-12.9 METs 8.3-10.6 METs ≥13.0 METs ≥10.7 METs Medicine, 346, 793–853.)
0
1 2 3 4 5
Quintiles of exercise capacity
This issue has also recently been addressed in clinical popula- the U.S. Surgeon General’s Report on Physical Activity and
tions, for example, patients referred for exercise testing for clinical Health published in 1996. This document represented the
reasons. 42,45–47,52,53 In a study performed among the U.S. Veter- strongest policy statement ever made by the U.S. Government
5
ans, 6,213 men underwent maximal exercise testing for clinical concerning physical activity. It represented a historic turning
45
reasons and were followed for a mean of 6.2 years. The subjects point redefining exercise as a key component to health promotion
were classified into five categories by gradients of fitness. After ad- and disease prevention. The federal government mounted a mul-
justment for age, the researchers observed that the largest gains in tiyear educational campaign based on this report. In this report,
terms of mortality were achieved between the lowest fitness group the epidemiologic evidence supporting physical activity in the
and the next lowest fitness group. Figure 37-1 illustrates the age- prevention of CHD morbidity and mortality is reviewed in detail.
adjusted relative risks associated with the different categories of The document also outlines the quantity of exercise necessary to
fitness. Among both normal subjects and those with cardiovascu- achieve these benefits. It is suggested that each person perform a
lar disease, the least fit individuals had more than four times the moderate amount of activity daily, with the amount of activity
risk of all-cause mortality compared with the most fit individuals. emphasized rather than the intensity. The concept is that this of-
Importantly, an individual’s fitness level was a stronger predictor fers people more opportunities for activities that fit into their daily
of mortality than established risk factors such as smoking, high lives. It is suggested that this moderate amount of activity be per-
blood pressure, high cholesterol, and diabetes. Over the past few formed for 30 minutes or more on most, and preferably all, days
years, other cohorts, such as those from the Cleveland Clinic 53 of the week. These activities can take the form of brisk walking,
and the Mayo Clinic, 46,47 have documented the importance of yard work or other household chores, jogging, or a wide variety of
exercise capacity as a predictor of mortality among clinically re- recreational activities. Repeated intermittent or shorter bouts of
ferred populations. These clinically based studies confirm earlier activity (e.g., 10 minutes), including occupational, nonoccupa-
observations from the Aerobics Center Longitudinal Study, 44 tional, or tasks of daily living, have similar cardiovascular and
Framingham, 54 and the LRC Trial 50 among asymptomatic pop- health benefits if performed at a level of moderate intensity with
ulations, underscoring the fact that fitness level has a strong an accumulated duration of at least 30 minutes per day. Individ-
influence on the incidence of cardiovascular and all-cause mor- uals who already meet these standards receive additional benefits
bidity and mortality. from increasing this amount to more vigorous activity.
The concept that all individuals should incorporate 30 min-
Public Health Policy Guidelines on utes of physical activity into their daily lives is a consistent theme
Physical Activity and Health in all of the recent consensus documents on physical activity and
health throughout the world. 1–5,7,55,56 Despite this evidence,
Over the last 15 years, numerous consensus guidelines have been however, most adults in Western societies remain effectively
published from organizations concerning physical activity and sedentary, 7,17,18 and only a minority of patients who are eligible
health, including the World Health Organization, ACSM, AHA, are referred to a cardiac rehabilitation program. 13 Given the dra-
CDC, and European Working Group on Exercise Physiology and matic increases over the last two decades in the prevalence of over-
Rehabilitation. 1–5,7,55,56 Among the most prominent of these was weight, obesity, diabetes, and other conditions related in part to