
Page 1523 - Hematology_ Basic Principles and Practice ( PDFDrive )
P. 1523
1350 Part VII Hematologic Malignancies
100
Overall survival
90 Failure-free survival
80
70
Survival (%) 50
60
40
30
20
10
0
0 1 2 3 4 5 6 7 8 9 10 11 12 13 14 15 16 17 18
Time (years)
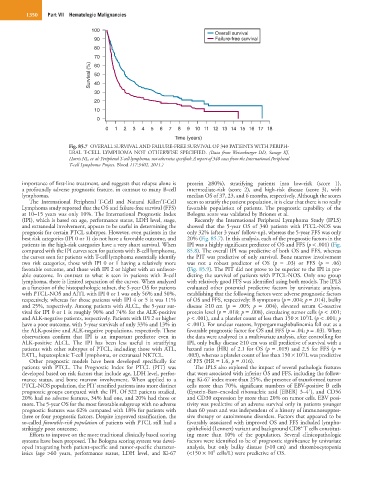
Fig. 85.7 OVERALL SURVIVAL AND FAILURE-FREE SURVIVAL OF 340 PATIENTS WITH PERIPH-
ERAL T-CELL LYMPHOMA NOT OTHERWISE SPECIFIED. (Data from Weisenburger DD, Savage KJ,
Harris NL, et al: Peripheral T-cell lymphoma, not otherwise specified: A report of 340 cases from the International Peripheral
T-cell Lymphoma Project. Blood 117:3402, 2011.)
importance of first-line treatment, and suggests that relapse alone is protein ≥80%), stratifying patients into low-risk (score 1),
a profoundly adverse prognostic feature, in contrast to many B-cell intermediate-risk (score 2), and high-risk disease (score 3), with
lymphomas. median OS of 37, 23, and 6 months, respectively. Although the scores
The International Peripheral T-Cell and Natural Killer/T-Cell seem to stratify the patient population, it is clear that there is no really
Lymphoma study reported that the OS and failure-free survival (FFS) favorable population of patients. The prognostic capability of the
at 10−15 years was only 10%. The International Prognostic Index Bologna score was validated by Briones et al.
(IPI), which is based on age, performance status, LDH level, stage, Recently the International Peripheral Lymphoma Study (IPLS)
and extranodal involvement, appears to be useful in determining the showed that the 5-year OS of 340 patients with PTCL-NOS was
prognosis for certain PTCL subtypes. However, even patients in the only 32% (after 3 years’ follow-up), whereas the 5-year FFS was only
best risk categories (IPI 0 or 1) do not have a favorable outcome, and 20% (Fig. 85.7). In this analysis, each of the prognostic factors in the
patients in the high-risk categories have a very short survival. When IPI was a highly significant predictor of OS and FFS (p < .001) (Fig.
compared with the IPI curves seen for patients with B-cell lymphoma, 85.8). The overall IPI was predictive of both OS and FFS, whereas
the curves seen for patients with T-cell lymphoma essentially identify the PIT was predictive of only survival. Bone marrow involvement
two risk categories, those with IPI 0 or 1 having a relatively more was not a robust predictor of OS (p = .03) or FFS (p = .06)
favorable outcome, and those with IPI 2 or higher with an unfavor- (Fig. 85.9). The PIT did not prove to be superior to the IPI in pre-
able outcome. In contrast to what is seen in patients with B-cell dicting the survival of patients with PTCL-NOS. Only one group
lymphoma, there is limited separation of the curves. When analyzed with relatively good FFS was identified using both models. The IPLS
as a function of the histopathologic subset, the 5-year OS for patients evaluated other potential predictive factors by univariate analysis,
with PTCL-NOS and AITL with IPI 0 or 1 was only 56% and 50%, establishing that the following factors were adverse prognostic factors
respectively, whereas for those patients with IPI 4 or 5 it was 11% of OS and FFS, respectively: B symptoms (p = .004; p = .014), bulky
and 25%, respectively. Among patients with ALCL, the 5-year sur- disease ≥10 cm (p = .005; p = .004), elevated serum C-reactive
vival for IPI 0 or 1 is roughly 90% and 74% for the ALK-positive protein level (p = .018; p = .008), circulating tumor cells (p < .001;
9
and ALK-negative patients, respectively. Patients with IPI 2 or higher p < .001), and a platelet count of less than 150 × 10 /L (p < .001; p
have a poor outcome, with 5-year survivals of only 33% and 13% in < .001). For unclear reasons, hypergammaglobulinemia fell out as a
the ALK-positive and ALK-negative populations, respectively. These favorable prognostic factor for OS and FFS (p = .04; p = .03). When
observations confirm that IPI is an important predictor even in the data were analyzed in a multivariate analysis, after controlling for
ALK-positive ALCL. The IPI has been less useful in stratifying IPI, only bulky disease ≥10 cm was still predictive of survival with a
patients with other subtypes of PTCL, including those with ATL, hazard ratio (HR) of 2.1 for OS (p = .019) and 2.5 for FFS (p =
9
EATL, hepatosplenic T-cell lymphoma, or extranasal NKTCL. .003), whereas a platelet count of less than 150 × 10 /L was predictive
Other prognostic models have been developed specifically for of FFS (HR = 1.6, p = .016).
patients with PTCL. The Prognostic Index for PTCL (PIT) was The IPLS also explored the impact of several pathologic features
developed based on risk factors that include age, LDH level, perfor- that were associated with inferior OS and FFS, including the follow-
mance status, and bone marrow involvement. When applied to a ing: Ki-67 index more than 25%, the presence of transformed tumor
PTCL-NOS population, the PIT stratified patients into more distinct cells more than 70%, significant numbers of EBV-positive B cells
+
prognostic groups compared with the IPI. Of 322 patients studied, (Epstein-Barr–encoded ribonucleic acid [EBER] 3–4 ), and CD56
20% had no adverse features, 34% had one, and 20% had three or and CD30 expression by more than 20% on tumor cells. EBV posi-
more. The 5-year OS for the most favorable subgroup with no adverse tivity was predictive of an adverse survival only in patients younger
prognostic features was 62% compared with 18% for patients with than 60 years and was independent of a history of immunosuppres-
three or four prognostic factors. Despite improved stratification, the sive therapy or autoimmune disorders. Factors that appeared to be
so-called favorable-risk population of patients with PTCL still had a favorably associated with improved OS and FFS included lympho-
+
strikingly poor outcome. epithelioid (Lennert) variant and background CD8 T cells constitut-
Efforts to improve on the more traditional clinically based scoring ing more than 10% of the population. Several clinicopathologic
systems have been proposed. The Bologna scoring system was devel- factors were identified to be of prognostic significance by univariate
oped integrating both patient-specific and tumor-specific character- analysis, but only bulky disease (>10 cm) and thrombocytopenia
9
istics (age >60 years, performance status, LDH level, and Ki-67 (<150 × 10 cells/L) were predictive of OS.