
Page 1795 - Hematology_ Basic Principles and Practice ( PDFDrive )
P. 1795
Chapter 104 Indications and Outcomes of Allogeneic Hematopoietic Cell Transplantation for Hematologic Malignancies in Adults 1599
TABLE Retrospective Registry-Based Comparisons of NMA/RIC versus Myeloablative Allogeneic HCT
104.2
TRM
Group Disease Donor RIC vs. MAC (N) RIC vs. MAC Relapse Comments
EBMT 33 MDS or sAML MUD 39% 315 vs. 407 32% vs. 44% 41% vs. 33% at 4 Survival 31% at 4 years. RIC predicted for
>50 at 4 years years greater relapse but lower TRM in
multivariate model. Wide variety of
different conditioning regimens used.
EBMT 34 MM MUD 12% 320 vs. 196 24% vs. 37% 27% vs. 54% TRM lower after RIC but relapse risk is
at 2 years double
EBMT 35 AML Sibling 215 vs. 621 22% vs. 32% 45% vs. 27% at 3 Relapse rate higher and TRM lower in RIC
at 3 years years but OS similar (41% vs. 45%) in both
groups.
EBMT 36 CLL MUD 22% 73 vs. 82 19% vs. 26% 28% vs. 11% Similar TRM but higher relapse risk after
RIC
EBMT 37 HL MUD 13% 89 vs. 79 23% vs. 46% 57% vs. 30% Relapse rate higher and TRM lower in RIC
at 1 year but OS similar
CIBMTR 38 Follicular NHL Sibling 88 vs. 120 23% in both 17% vs. 8% RIC associated with higher risk of relapse
at 1 year but similar TRM while lower KPS
impacted on TRM. OS was similar.
EBMT 39 ALL Sibling 127 vs. 449 21% vs. 29% 32% vs. 38% TRM lower after RIC but higher relapse rate.
Leukemia-free survival similar to MAC
CIBMTR 40 AML/MDS MUD/Sibling 1448 vs. 3731 3-year TRM Lower risk of relapse Overall and disease-free survival was highest
similar in Myeloablative for myeloablative group
ALL, Acute lymphoblastic leukemia; AML, acute myeloid leukemia; CIBMTR, Center for International Blood and Marrow Transplant Research; CLL, chronic lymphocytic
leukemia; EBMT, European Society for Blood and Marrow transplantation; HCT, hematopoietic cell transplantation; HL, Hodgkin lymphoma; KPS, Karnofsky performance
score; MAC, myeloablative conditioning; MDS, myelodysplastic syndrome; MM, multiple myeloma; MUD, matched unrelated donor; NHL, Non-Hodgkin lymphoma;
NMA, nonmyeloablative; OS, overall survival; RIC, reduced intensity conditioning; TRM, transplant-related mortality; sAML, secondary acute myeloid leukemia.
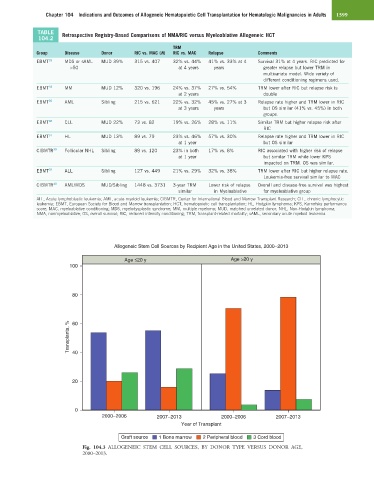
Allogeneic Stem Cell Sources by Recipient Age in the United States, 2000−2013
Age ≤20 y Age >20 y
100
80
Transplants, % 60
40
20
0
2000−2006 2007−2013 2000−2006 2007−2013
Year of Transplant
Graft source 1 Bone marrow 2 Peripheral blood 3 Cord blood
Fig. 104.3 ALLOGENEIC STEM CELL SOURCES, BY DONOR TYPE VERSUS DONOR AGE,
2000–2013.