
Page 2645 - Hematology_ Basic Principles and Practice ( PDFDrive )
P. 2645
e26 Part XIII Consultative Hematology
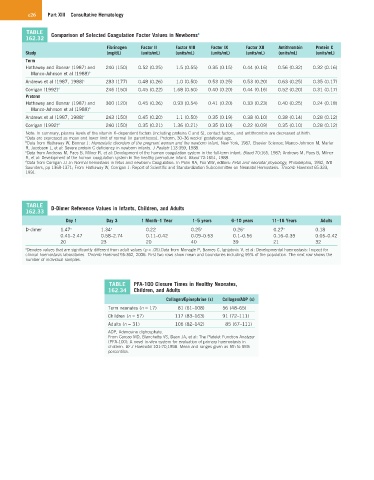
TABLE a
162.32 Comparison of Selected Coagulation Factor Values in Newborns
Fibrinogen Factor II Factor VIII Factor IX Factor XII Antithrombin Protein C
Study (mg/dL) (units/mL) (units/mL) (units/mL) (units/mL) (units/mL) (units/mL)
Term
Hathaway and Bonnar (1987) and 240 (150) 0.52 (0.25) 1.5 (0.55) 0.35 (0.15) 0.44 (0.16) 0.56 (0.32) 0.32 (0.16)
Manco-Johnson et al (1988) b
Andrews et al (1987, 1988) c 283 (177) 0.48 (0.26) 1.0 (0.50) 0.53 (0.25) 0.53 (0.20) 0.63 (0.25) 0.35 (0.17)
Corrigan (1992) d 246 (150) 0.45 (0.22) 1.68 (0.50) 0.40 (0.20) 0.44 (0.16) 0.52 (0.20) 0.31 (0.17)
Preterm
Hathaway and Bonnar (1987) and 300 (120) 0.45 (0.26) 0.93 (0.54) 0.41 (0.20) 0.33 (0.23) 0.40 (0.25) 0.24 (0.18)
Manco-Johnson et al (1988) b
Andrews et al (1987, 1988) c 243 (150) 0.45 (0.20) 1.1 (0.50) 0.35 (0.19) 0.38 (0.10) 0.38 (0.14) 0.28 (0.12)
Corrigan (1992) d 240 (150) 0.35 (0.21) 1.36 (0.21) 0.35 (0.10) 0.22 (0.09) 0.35 (0.10) 0.28 (0.12)
Note: In summary, plasma levels of the vitamin K–dependent factors (including proteins C and S), contact factors, and antithrombin are decreased at birth.
a Data are expressed as mean and lower limit of normal (in parentheses). Preterm, 30–36 weeks’ gestational age.
b Data from Hathaway W, Bonnar J: Hemostatic disorders of the pregnant woman and the newborn infant, New York, 1987, Elsevier Science; Manco-Johnson M, Marlar
R, Jacobson L, et al: Severe protein C deficiency in newborn infants. J Pediatr 113:359, 1988.
c Data from Andrews M, Paes B, Milner R, et al: Development of the human coagulation system in the full-term infant. Blood 70:165, 1987; Andrews M, Paes B, Milner
R, et al: Development of the human coagulation system in the healthy premature infant. Blood 72:1651, 1988.
d Data from Corrigan JJ Jr: Normal hemostasis in fetus and newborn: Coagulation. In Polin RA, Fox WW, editors: Fetal and neonatal physiology, Philadelphia, 1992, WB
Saunders, pp 1368-1371; From Hathaway W, Corrigan J: Report of Scientific and Standardization Subcommittee on Neonatal Hemostasis. Thromb Haemost 65:323,
1991.
TABLE
162.33 D-Dimer Reference Values in Infants, Children, and Adults
Day 1 Day 3 1 Month–1 Year 1–5 years 6–10 years 11–16 Years Adults
D-dimer 1.47 a 1.34 a 0.22 0.25 a 0.26 a 0.27 a 0.18
0.41–2.47 0.58–2.74 0.11–0.42 0.09–0.53 0.1–0.56 0.16–0.39 0.05–0.42
20 23 20 40 39 21 32
a Denotes values that are significantly different from adult values (p < .05).Data from Monagle P, Barnes C, Ignjatovic V, et al: Developmental haemostasis: Impact for
clinical haemostasis laboratories. Thromb Haemost 95:362, 2006. First two rows show mean and boundaries including 95% of the population. The next row shows the
number of individual samples.
TABLE PFA-100 Closure Times in Healthy Neonates,
162.34 Children, and Adults
Collagen/Epinephrine (s) Collagen/ADP (s)
Term neonates (n = 17) 81 (61–108) 56 (48–65)
Children (n = 57) 117 (83–163) 91 (72–111)
Adults (n = 31) 106 (82–142) 85 (67–111)
ADP, Adenosine diphosphate.
From Carcao MD, Blanchette VS, Dean JA, et al: The Platelet Function Analyzer
(PFA-100): A novel in-vitro system for evaluation of primary haemostasis in
children. Br J Haematol 101:70,1998. Mean and ranges given as 5th to 95th
percentiles.