
Page 2644 - Hematology_ Basic Principles and Practice ( PDFDrive )
P. 2644
Chapter 162 Resources for the Hematologist e25
TABLE
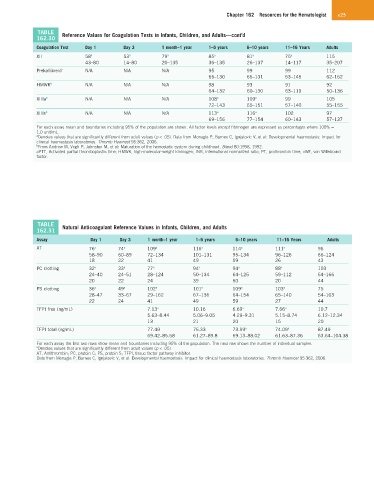
162.30 Reference Values for Coagulation Tests in Infants, Children, and Adults—cont’d
Coagulation Test Day 1 Day 3 1 month–1 year 1–5 years 6–10 years 11–16 Years Adults
XII 58 a 53 a 79 a 85 a 81 a 75 a 115
43–80 14–80 20–135 36–135 26–137 14–117 35–207
Prekallikrein b N/A N/A N/A 95 99 99 112
65–130 66–131 53–145 62–162
HMWK b N/A N/A N/A 98 93 91 92
64–132 60–130 63–119 50–136
XIIIa b N/A N/A N/A 108 a 109 a 99 105
72–143 65–151 57–140 55–155
XIIIs b N/A N/A N/A 113 a 116 a 102 97
69–156 77–154 60–143 57–137
For each assay mean and boundaries including 95% of the population are shown. All factor levels except fibrinogen are expressed as percentages where 100% =
1.0 unit/mL.
a Denotes values that are significantly different from adult values (p < .05). Data from Monagle P, Barnes C, Ignjatovic V, et al: Developmental haemostasis: Impact for
clinical haemostasis laboratories. Thromb Haemost 95:362, 2006.
b From Andrew M, Vegh P, Johnston M, et al: Maturation of the hemostatic system during childhood. Blood 80:1998, 1992.
aPTT, Activated partial thromboplastin time; HMWK, high-molecular-weight kininogen; INR, international normalized ratio; PT, prothrombin time; vWF, von Willebrand
factor.
TABLE
162.31 Natural Anticoagulant Reference Values in Infants, Children, and Adults
Assay Day 1 Day 3 1 month–1 year 1–5 years 6–10 years 11–16 Years Adults
AT 76 a 74 a 109 a 116 a 114 a 111 a 96
58–90 60–89 72–134 101–131 95–134 96–126 66–124
18 22 41 49 59 26 43
PC clotting 32 a 33 a 77 a 94 a 94 a 88 a 103
24–40 24–51 28–124 50–134 64–125 59–112 54–166
20 22 24 39 50 20 44
PS clotting 36 a 49 a 102 a 101 a 109 a 103 a 75
28–47 33–67 29–162 67–136 64–154 65–140 54–103
22 24 41 49 59 27 44
TFPI free (ng/mL) 7.13 a 10.16 6.69 a 7.66 a 10.7
5.63–8.44 5.06–9.05 4.29–9.31 5.15–8.74 6.12–12.34
13 21 20 15 20
TFPI total (ng/mL) 77.49 76.33 73.99 a 74.09 a 87.49
69.42–85.58 61.27–89.8 59.13–88.02 61.63–87.36 63.64–104.38
For each assay the first two rows show mean and boundaries including 95% of the population. The next row shows the number of individual samples.
a Denotes values that are significantly different from adult values (p < .05).
AT, Antithrombin; PC, protein C; PS, protein S; TFPI, tissue factor pathway inhibitor.
Data from Monagle P, Barnes C, Ignjatovic V, et al: Developmental haemostasis: Impact for clinical haemostasis laboratories. Thromb Haemost 95:362, 2006.