
Page 2642 - Hematology_ Basic Principles and Practice ( PDFDrive )
P. 2642
Chapter 162 Resources for the Hematologist e23
TABLE
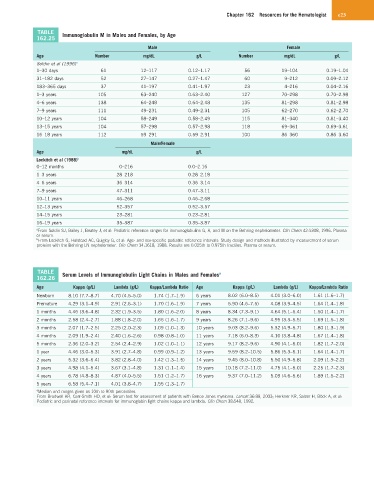
162.25 Immunoglobulin M in Males and Females, by Age
Male Female
Age Number mg/dL g/L Number mg/dL g/L
Soldin et al (1996) a
1–30 days 61 12–117 0.12–1.17 56 19–104 0.19–1.04
31–182 days 52 27–147 0.27–1.47 60 9–212 0.09–2.12
183–365 days 37 41–197 0.41–1.97 23 4–216 0.04–2.16
1–3 years 105 63–240 0.63–2.40 127 70–298 0.70–2.98
4–6 years 138 64–248 0.64–2.48 135 81–298 0.81–2.98
7–9 years 111 49–231 0.49–2.31 105 62–270 0.62–2.70
10–12 years 104 58–249 0.58–2.49 115 81–340 0.81–3.40
13–15 years 104 57–298 0.57–2.98 118 69–361 0.69–3.61
16–18 years 112 59–291 0.59–2.91 100 86–360 0.86–3.60
Male/Female
Age mg/dL g/L
Lockitch et al (1988) b
0–12 months 0–216 0.0–2.16
1–3 years 28–218 0.28–2.18
4–6 years 36–314 0.36–3.14
7–9 years 47–311 0.47–3.11
10–11 years 46–268 0.46–2.68
12–13 years 52–357 0.52–3.57
14–15 years 23–281 0.23–2.81
16–19 years 35–387 0.35–3.87
a From Soldin SJ, Bailey J, Beatey J, et al: Pediatric reference ranges for immunoglobulins G, A, and M on the Behring nephelometer. Clin Chem 42:S308, 1996. Plasma
or serum.
b From Lockitch G, Halstead AC, Quigley G, et al: Age- and sex-specific pediatric reference intervals: Study design and methods illustrated by measurement of serum
proteins with the Behring LN nephelometer. Clin Chem 34:1618, 1988. Results are 0.025th to 0.975th fractiles. Plasma or serum.
TABLE a
162.26 Serum Levels of Immunoglobulin Light Chains in Males and Females
Age Kappa (g/L) Lambda (g/L) Kappa/Lambda Ratio Age Kappa (g/L) Lambda (g/L) Kappa/Lambda Ratio
Newborn 8.10 (7.7–8.7) 4.70 (4.5–5.0) 1.74 (1.7–1.9) 6 years 8.02 (6.0–8.5) 4.01 (3.0–6.0) 1.61 (1.6–1.7)
Premature 4.29 (3.1–4.9) 2.91 (2.6–3.1) 1.70 (1.6–1.9) 7 years 5.90 (4.6–7.5) 4.08 (3.9–4.5) 1.64 (1.4–1.8)
1 months 4.46 (3.6–4.8) 2.32 (1.9–3.5) 1.80 (1.6–2.0) 8 years 8.34 (7.3–9.1) 4.64 (5.1–6.4) 1.50 (1.4–1.7)
2 months 2.58 (2.4–2.7) 1.88 (1.8–2.0) 1.66 (1.6–1.7) 9 years 8.26 (7.1–9.6) 4.95 (3.3–5.5) 1.69 (1.5–1.8)
3 months 2.07 (1.7–2.5) 2.25 (2.0–2.3) 1.09 (1.0–1.3) 10 years 9.03 (8.2–9.6) 5.32 (4.9–5.7) 1.80 (1.3–1.9)
4 months 2.09 (1.9–2.4) 2.40 (1.6–2.6) 0.98 (0.8–1.0) 11 years 7.18 (6.0–8.3) 4.10 (3.8–4.8) 1.67 (1.4–1.8)
5 months 2.36 (2.0–3.2) 2.54 (2.4–2.9) 1.02 (1.0–1.1) 12 years 9.17 (8.2–9.6) 4.90 (4.1–6.0) 1.82 (1.7–2.0)
1 year 4.46 (3.0–5.3) 3.91 (2.7–4.8) 0.99 (0.9–1.2) 13 years 9.59 (8.2–10.5) 5.86 (5.3–6.1) 1.64 (1.4–1.7)
2 years 5.32 (3.6–6.4) 3.82 (2.8–4.0) 1.42 (1.3–1.5) 14 years 9.45 (8.0–10.8) 5.50 (4.9–5.8) 2.09 (1.9–2.2)
3 years 4.98 (4.1–5.4) 3.67 (3.1–4.8) 1.31 (1.1–1.4) 15 years 10.18 (7.2–11.0) 4.75 (4.1–5.0) 2.25 (1.7–2.3)
4 years 6.78 (4.8–8.3) 4.87 (4.0–5.5) 1.51 (1.2–1.7) 16 years 9.37 (7.0–11.2) 5.09 (4.6–5.6) 1.89 (1.5–2.2)
5 years 6.58 (5.4–7.1) 4.01 (3.8–4.7) 1.55 (1.3–1.7)
a Median and ranges given as 10th to 90th percentiles.
From Bradwell AR, Carr-Smith HD, et al: Serum test for assessment of patients with Bence Jones myeloma. Lancet 36:89, 2003; Herkner KR, Salzer H, Böck A, et al:
Pediatric and perinatal reference intervals for immunoglobin light chains kappa and lambda. Clin Chem 38:548, 1992.