
Page 58 - Hematology_ Basic Principles and Practice ( PDFDrive )
P. 58
30 Part I Molecular and Cellular Basis of Hematology
0.1 00221 0.4 0.1 0.2 0.28 0.4
1p31.1
1 1p12 1
2 2
3 3
4p15.2
4 4
5 5
6 6
7 7
8 8
8q24.21
9 9
10 10
11 11
12 12
12q24.33
13 13q14.2 13
14 14q24.2 14
15 15
16 16
17 17
18 18
19 19 19p13.2
20 20q11.23 20
21 22 21 22
0.25 10 –2 10 –3 10 –4 10 –6 0.25 10 –1 10 –2 10 –3 10 –4
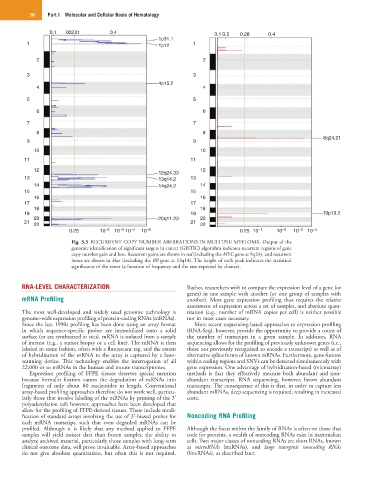
Fig. 3.3 RECURRENT COPY NUMBER ABERRATIONS IN MULTIPLE MYELOMA. Output of the
genomic identification of significant targets in cancer (GISTIC) algorithm indicates recurrent regions of gene
copy number gain and loss. Recurrent gains are shown in red (including the MYC gene at 8q24), and recurrent
losses are shown in blue (including the RB gene at 13q14). The height of each peak indicates the statistical
significance of the event (a function of frequency and the rate expected by chance).
RNA-LEVEL CHARACTERIZATION Rather, researchers wish to compare the expression level of a gene (or
genes) in one sample with another (or one group of samples with
mRNA Profiling another). Most gene expression profiling thus requires the relative
assessment of expression across a set of samples, and absolute quan-
The most well-developed and widely used genomic technology is titation (e.g., number of mRNA copies per cell) is neither possible
genome-wide expression profiling of protein-coding RNAs (mRNAs). nor in most cases necessary.
Since the late 1990s profiling has been done using an array format More recent sequencing-based approaches to expression profiling
in which sequence-specific probes are immobilized onto a solid (RNA-Seq), however, provide the opportunity to provide a count of
surface (or are synthesized in situ). mRNA is isolated from a sample the number of transcripts in a given sample. In addition, RNA
of interest (e.g., a tumor biopsy or a cell line). The mRNA is then sequencing allows for the profiling of previously unknown genes (i.e.,
labeled in some fashion, often with a fluorescent tag, and the extent those not previously recognized to encode a transcript) as well as of
of hybridization of the mRNA to the array is captured by a laser- alternative splice forms of known mRNAs. Furthermore, gene fusions
scanning device. This technology enables the interrogation of all within coding regions and SNVs can be detected simultaneously with
22,000 or so mRNAs in the human and mouse transcriptomes. gene expression. One advantage of hybridization-based (microarray)
Expression profiling of FFPE tissues deserves special mention methods is that they effectively measure both abundant and non-
because formalin fixation causes the degradation of mRNAs into abundant transcripts. RNA sequencing, however, favors abundant
fragments of only about 80 nucleotides in length. Conventional transcripts. The consequence of this is that, in order to capture less
array-based profiling approaches therefore do not work well, particu- abundant mRNAs, deep sequencing is required, resulting in increased
larly those that involve labeling of the mRNAs by priming of the 3′ costs.
polyadenylation tail; however, approaches have been developed that
allow for the profiling of FFPE-derived tissues. These include modi-
fication of standard arrays involving the use of 3′-biased probes for Noncoding RNA Profiling
each mRNA transcript, such that even degraded mRNAs can be
profiled. Although it is likely that any method applied to FFPE Although the focus within the family of RNAs is often on those that
samples will yield noisier data than frozen samples, the ability to code for proteins, a wealth of noncoding RNAs exist in mammalian
analyze archived material, particularly those samples with long-term cells. Two major classes of noncoding RNAs are short RNAs, known
clinical outcome data, will prove invaluable. Array-based approaches as microRNAs (miRNAs), and large intergenic noncoding RNAs
do not give absolute quantitation, but often this is not required. (lincRNAs), as described later.