
Page 529 - Williams Hematology ( PDFDrive )
P. 529
504 Part VI: The Erythrocyte Chapter 34: Clinical Manifestations and Classification of Erythrocyte Disorders 505
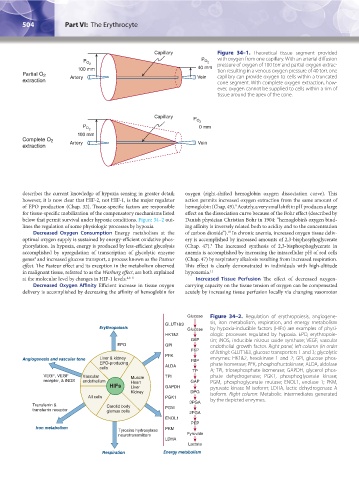
Capillary Figure 34–1. Theoretical tissue segment provided
P O 2 P O 2 with oxygen from one capillary. With an arterial diffusion
pressure of oxygen of 100 torr and partial oxygen extrac-
100 mm 40 mm tion resulting in a venous oxygen pressure of 40 torr, one
Partial O 2 Vein capillary can provide oxygen to cells within a truncated
extraction Artery cone segment. With complete oxygen extraction, how-
ever, oxygen cannot be supplied to cells within a rim of
tissue around the apex of the cone.
Capillary P O 2
P O 0 mm
2
100 mm
Complete O 2 Artery Vein
extraction
describes the current knowledge of hypoxia sensing in greater detail; oxygen (right-shifted hemoglobin oxygen dissociation curve). This
however, it is now clear that HIF-2, not HIF-1, is the major regulator action permits increased oxygen extraction from the same amount of
of EPO production (Chap. 32). Tissue-specific factors are responsible hemoglobin (Chap. 49). Acutely, a very small shift in pH produces a large
9
for tissue-specific mobilization of the compensatory mechanisms listed effect on the dissociation curve because of the Bohr effect (described by
below that permit survival under hypoxic conditions. Figure 34–2 out- Danish physician Christian Bohr in 1904: “hemoglobin’s oxygen bind-
lines the regulation of some physiologic processes by hypoxia. ing affinity is inversely related both to acidity and to the concentration
Decreased Oxygen Consumption Energy metabolism at the of carbon dioxide”). In chronic anemia, increased oxygen tissue deliv-
10
optimal oxygen supply is sustained by energy-efficient oxidative phos- ery is accomplished by increased amounts of 2,3-bisphosphoglycerate
phorylation. In hypoxia, energy is produced by less-efficient glycolysis (Chap. 47). The increased synthesis of 2,3-bisphosphoglycerate in
9
accomplished by upregulation of transcription of glycolytic enzyme anemia is accomplished by increasing the intracellular pH of red cells
genes and increased glucose transport, a process known as the Pasteur (Chap. 47) by respiratory alkalosis resulting from increased respiration.
4
effect. The Pasteur effect and its exception in the metabolism observed This effect is clearly demonstrated in individuals with high-altitude
in malignant tissue, referred to as the Warburg effect, are both explained hypoxemia. 11
at the molecular level by changes in HIF-1 levels. 4,6–8 Increased Tissue Perfusion The effect of decreased oxygen-
Decreased Oxygen Affinity Efficient increase in tissue oxygen carrying capacity on the tissue tension of oxygen can be compensated
delivery is accomplished by decreasing the affinity of hemoglobin for acutely by increasing tissue perfusion locally via changing vasomotor
Glucose Figure 34–2. Regulation of erythropoiesis, angiogene-
GLUT1&3 sis, iron metabolism, respiration, and energy metabolism
Erythropoiesis Glucose by hypoxia-inducible factors (HIFs) are examples of physi-
HK1&2 ologic processes regulated by hypoxia. EPO, erythropoie-
G6P tin; iNOS, inducible nitrous oxide synthase; VEGF, vascular
EPO GPI endothelial growth factor. Right panel, left column (in order
F6P of listing): GLUT1&3, glucose transporters 1 and 3; glycolytic
PFK
Angiogenesis and vascular tone Liver & kidney FBP enzymes: HK1&2, hexokinase 1 and 2; GPI, glucose phos-
EPO-producing phate isomerase; PFK, phosphofructokinase; ALDA, aldolase
cells ALDA
TP A; TPI, triosephosphate isomerase; GAPDH, glycerol phos-
VEGF, VEGF Vascular Muscle TPI phate dehydrogenase; PGK1, phosphoglycerate kinase;
receptor, & iNOS endothelium Heart GAP PGM, phosphoglycerate mutase; ENOL1, enolase 1; PKM,
HIFs Liver GAPDH pyruvate kinase M isoform; LDHA, lactic dehydrogenase A
Kidney DPG isoform. Right column: Metabolic intermediates generated
All cells PGK1 by the depicted enzymes.
3PGA
Transferrin & Carotid body
transferrin receptor glomus cells PGM 2PGA
ENOL1
PEP
Iron metabolism PKM
Tyrosine hydroxylase
neurotransmitters Pyruvate
LDHA
Lactate
Respiration Energy metabolism
Kaushansky_chapter 34_p0503-0512.indd 504 9/17/15 6:12 PM