
Page 660 - Williams Hematology ( PDFDrive )
P. 660
634 Part VI: The Erythrocyte Chapter 43: Iron Deficiency and Overload 635
of some malignancies, as well as of acute and chronic liver disease and 100 Hypothetical
chronic renal failure. 150–153 In Gaucher disease, juvenile rheumatoid test
arthritis, and various macrophage activation syndromes, and in ferro- 75
portin disease characterized by massive iron loading of macrophages, Ferritin
the serum ferritin concentration is commonly in the range of thousands
of mcg/L and may mask iron deficiency. 154–158 Sensitivity 50
Erythrocyte Zinc Protoporphyrin 25
Erythrocyte protoporphyrin, principally zinc protoporphyrin, is
increased in disorders of heme synthesis, including iron deficiency, lead 0
75
poisoning, and sideroblastic anemias, as well as other conditions. 159–161 0 25 50 75 100
This assay analyzes the fluorescence of erythrocytes and uses small 100% – Specificity%
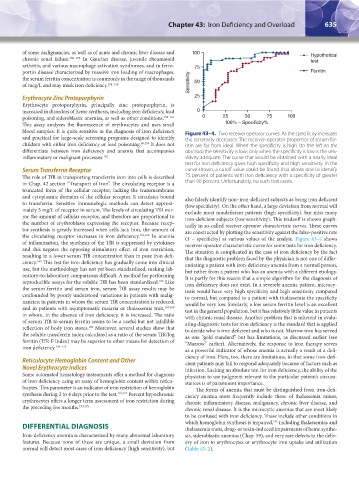
blood samples. It is quite sensitive in the diagnosis of iron deficiency Figure 43–4. Two receiver operator curves. As the specificity increases
and practical for large-scale screening programs designed to identify the sensitivity decreases. The receiver-operator properties of serum fer-
children with either iron deficiency or lead poisoning. 58,159 It does not ritin are far from ideal. When the specificity is high (to the left on the
differentiate between iron deficiency and anemia that accompanies abscissa) the sensitivity is low; only when the specificity is low is the sen-
inflammatory or malignant processes. 162 sitivity adequate. The curve that would be obtained with a nearly ideal
test for iron deficiency gives high specificity and high sensitivity. In the
Serum Transferrin Receptor curve shown, a cutoff value could be found that allows one to identify
The role of TfR in transporting transferrin iron into cells is described 75 percent of patients with iron deficiency with a specificity of greater
in Chap. 42 section “Transport of Iron”. The circulating receptor is a than 90 percent. Unfortunately, no such test exists.
truncated form of the cellular receptor, lacking the transmembrane
and cytoplasmic domains of the cellular receptor. It circulates bound also falsely identify non–iron-deficient subjects as being iron deficient
to transferrin. Sensitive immunologic methods can detect approxi- (low specificity). On the other hand, a large deviation from normal will
mately 5 mg/L of receptor in serum. The levels of circulating TfR mir- exclude most nondeficient patients (high specificity), but miss many
ror the amount of cellular receptor, and therefore are proportional to iron-deficient subjects (low sensitivity). This tradeoff is shown graph-
the number of erythroblasts expressing the receptor. Because recep- ically in so-called receiver operator characteristic curves. These curves
tor synthesis is greatly increased when cells lack iron, the amount of are constructed by plotting the sensitivity against the false-positive rate
the circulating receptor increases in iron deficiency. 163,164 In anemia (1 − specificity) at various values of the analyte. Figure 43–4 shows
of inflammation, the synthesis of the TfR is suppressed by cytokines receiver operator characteristic curve for some tests for iron deficiency.
and this negates the opposing stimulatory effect of iron restriction, The situation is complicated in the case of iron deficiency by the fact
resulting in a lower serum TfR concentration than in pure iron defi- that the diagnostic problem faced by the physician is not one of differ-
165
ciency. This test for iron deficiency has gradually come into clinical entiating a patient with iron-deficiency anemia from a normal person,
use, but the methodology has not yet been standardized, making lab- but rather from a patient who has an anemia with a different etiology.
oratory-to-laboratory comparisons difficult. A method for performing It is partly for this reason that a simple algorithm for the diagnosis of
166
reproducible assays for the soluble TfR has been standardized. Like iron deficiency does not exist. In a severely anemic patient, microcy-
the serum ferritin and serum iron, serum TfR assay results may be tosis would have very high specificity and high sensitivity compared
confounded by poorly understood variations in patients with malig- to normal, but compared to a patient with thalassemia the specificity
nancies; in patients in whom the serum TfR concentration is reduced; would be very low. Similarly, a low serum ferritin level is an excellent
and in patients with asymptomatic malaria or thalassemia trait, 167,168 test in the general population, but it has relatively little value in patients
in whom, in the absence of iron deficiency, it is increased. The ratio with chronic renal disease. Another problem that is inherent in evalu-
of serum TfR to serum ferritin seems to be a useful but not infallible ating diagnostic tests for iron deficiency is the standard that is applied
reflection of body iron stores. Moreover, several studies show that to decide who is iron deficient and who is not. Marrow iron has served
169
the soluble transferrin index calculated as a ratio of the serum TfR/log as one “gold standard” but has limitations, as discussed earlier (see
ferritin (TfR-F Index) may be superior to other means for detection of “Marrow” earlier). Alternatively, the response to iron therapy serves
iron deficiency. 170–172 as a powerful indicator of whose anemia is actually a result of a defi-
ciency of iron. Here, too, there are limitations, in that some iron-defi-
Reticulocyte Hemoglobin Content and Other cient patients may fail to respond adequately because of factors such as
Novel Erythrocyte Indices infection. Lacking an absolute test for iron deficiency, the ability of the
Some automated hematology instruments offer a method for diagnosis physician to use judgment relevant to the particular patient’s circum-
of iron deficiency using an assay of hemoglobin content within reticu- stances is of paramount importance.
locytes. This parameter is an indicator of iron restriction of hemoglobin The forms of anemia that must be distinguished from iron-defi-
synthesis during 3 to 4 days prior to the test. 173,174 Percent hypochromic ciency anemia most frequently include those of thalassemia minor,
erythrocytes offers a longer term assessment of iron restriction during chronic inflammatory disease, malignancy, chronic liver disease, and
the preceding few months. 173,175 chronic renal disease. It is the microcytic anemias that are most likely
to be confused with iron deficiency. These include other conditions in
which hemoglobin synthesis is impaired, including thalassemias and
176
DIFFERENTIAL DIAGNOSIS thalassemia traits, drug- or toxin-induced impairments of heme synthe-
Iron-deficiency anemia is characterized by many abnormal laboratory sis, sideroblastic anemias (Chap. 59), and very rare defects in the deliv-
features. Because none of these are unique, a small deviation from ery of iron to erythrocytes or erythrocyte iron uptake and utilization
normal will detect most cases of iron deficiency (high sensitivity), but (Table 43–2).
Kaushansky_chapter 43_p0627-0650.indd 635 9/17/15 6:27 PM